OPEN-SOURCE SCRIPT
已更新 Compare Symbol [LuxmiAI]

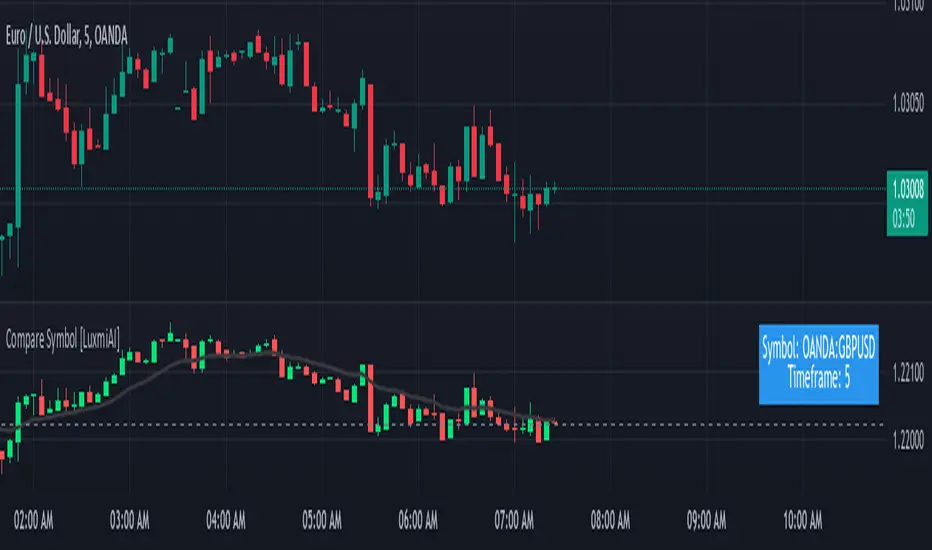
This indicator allows users to plot candles or bars for a selected symbol and add a moving average of their choice as an underlay. Users can customize the moving average type and length, making it versatile for a wide range of trading strategies.
This script is designed to offer flexibility, letting traders select the symbol, timeframe, candle style, and moving average type directly from the input options. The moving averages include the Exponential Moving Average (EMA), Simple Moving Average (SMA), Weighted Moving Average (WMA), and Volume-Weighted Moving Average (VWMA).
Features of the Script
This indicator provides the following key features:
1. Symbol Selection: Users can input the ticker symbol for which they want to plot the data.
2. Timeframe Selection: The script allows users to choose a timeframe for the symbol data.
3. Candle Styles: Users can select from three styles - regular candles, bars, or Heikin-Ashi candles.
4. Moving Average Options: Users can choose between EMA, SMA, WMA, and VWMA for added trend analysis.
5. Customizable Moving Average Length: The length of the moving average can be adjusted to suit individual trading strategies.
How the Script Works
The script starts by taking user inputs for the symbol and timeframe. It then retrieves the open, high, low, and close prices of the selected symbol and timeframe using the request.security function. Users can select between three candle styles: standard candles, bars, and Heikin-Ashi candles. If Heikin-Ashi candles are selected, the script calculates the Heikin-Ashi open, high, low, and close values.
To add further analysis capabilities, the script includes a moving average. Traders can select the moving average type from EMA, SMA, WMA, or VWMA and specify the desired length. The selected moving average is then plotted on the chart to provide a clear visualization of the trend.
Step-by-Step Implementation
1. Input Options: The script starts by taking inputs for the symbol, timeframe, candle style, moving average type, and length.
2. Data Retrieval: The script fetches OHLC data for the selected symbol and timeframe using request.security.
3. Candle Style Logic: It determines which candle style to plot based on the user’s selection. If Heikin-Ashi is selected, the script calculates Heikin-Ashi values.
4. Moving Average Calculation: Depending on the user’s choice, the script calculates the selected moving average.
5. Visualization: The script plots the candles or bars and overlays the moving average on the chart.
Benefits of Using This Indicator
This custom indicator provides multiple benefits for traders. It allows for quick comparisons between symbols and timeframes, helping traders identify trends and patterns. The flexibility to choose different candle styles and moving averages enhances its adaptability to various trading strategies. Additionally, the ability to customize the moving average length makes it suitable for both short-term and long-term analysis.
版本注释
Added symbol name and timeframe of the comparing symbol as a label. 版本注释
HA calculation bug fix..版本注释
Bug fix..开源脚本
秉承TradingView的精神,该脚本的作者将其开源,以便交易者可以查看和验证其功能。向作者致敬!您可以免费使用该脚本,但请记住,重新发布代码须遵守我们的网站规则。
免责声明
这些信息和出版物并非旨在提供,也不构成TradingView提供或认可的任何形式的财务、投资、交易或其他类型的建议或推荐。请阅读使用条款了解更多信息。
开源脚本
秉承TradingView的精神,该脚本的作者将其开源,以便交易者可以查看和验证其功能。向作者致敬!您可以免费使用该脚本,但请记住,重新发布代码须遵守我们的网站规则。
免责声明
这些信息和出版物并非旨在提供,也不构成TradingView提供或认可的任何形式的财务、投资、交易或其他类型的建议或推荐。请阅读使用条款了解更多信息。