PROTECTED SOURCE SCRIPT
Sacred: Cycles

"Cycles offer freedom to those who see them, and fate to those who don't."
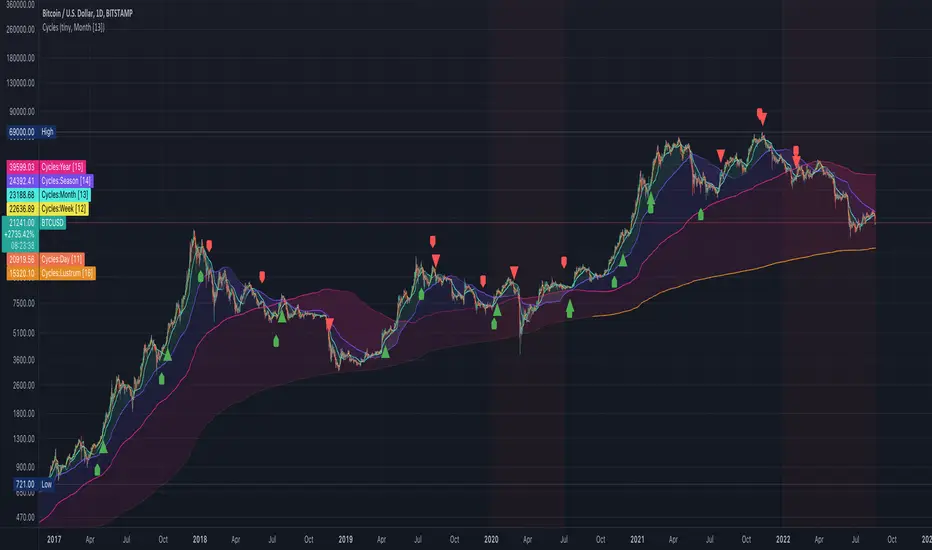
Following liquidity cycles is one of the most useful tools of making in financial markets. Over the longer term, it helps you get in at the beginning of plenty and out before the droughts. This script aims to simplify that for the average trader by displaying tree types of information:
Currents
More often than you might imagine, prices are interacting with moving averages across various timeframes. Zoom in or out enough and you'll probably find a moving average that intersects any given price turn/pause. But how to find them? It turns out if you take a fractal approach and scale up or down common time periods, you can generate surprisingly useful support and resistance levels you wouldn't otherwise plot. I call these moving averages "currents". By changing time intervals, you'll be able to find which current is affecting your charts price. (Note: Only works with tickers that have volume data.)

Financial Conditions
Proper technical analysis will give you an idea of which price levels are important and when a pattern is likely to resolve. But how to decide which direction you should bet on? That's where liquidity comes into play. For those tickers that are sensitive to broader liquidity conditions, these markers will tell you if you're in a bearish or bullish regime. After a bearish marker, it's time to sell rips. In a bearish one, buy the dip.

Recessions
Waiting for recessions to be announced by the NBER is a waste of time. You need to know today if recessionary conditions exist. That's where following coincident growth indicators instead of lagging ones helps. This script adds a red background to indicate weakening US growth.

Following liquidity cycles is one of the most useful tools of making in financial markets. Over the longer term, it helps you get in at the beginning of plenty and out before the droughts. This script aims to simplify that for the average trader by displaying tree types of information:
Currents
More often than you might imagine, prices are interacting with moving averages across various timeframes. Zoom in or out enough and you'll probably find a moving average that intersects any given price turn/pause. But how to find them? It turns out if you take a fractal approach and scale up or down common time periods, you can generate surprisingly useful support and resistance levels you wouldn't otherwise plot. I call these moving averages "currents". By changing time intervals, you'll be able to find which current is affecting your charts price. (Note: Only works with tickers that have volume data.)
Financial Conditions
Proper technical analysis will give you an idea of which price levels are important and when a pattern is likely to resolve. But how to decide which direction you should bet on? That's where liquidity comes into play. For those tickers that are sensitive to broader liquidity conditions, these markers will tell you if you're in a bearish or bullish regime. After a bearish marker, it's time to sell rips. In a bearish one, buy the dip.
Recessions
Waiting for recessions to be announced by the NBER is a waste of time. You need to know today if recessionary conditions exist. That's where following coincident growth indicators instead of lagging ones helps. This script adds a red background to indicate weakening US growth.
受保护脚本
此脚本以闭源形式发布。 但是,您可以自由使用,没有任何限制 — 了解更多信息这里。
"Even the wise cannot see all ends." - Gandalf
Connect with me on Twitter. I'm always open to discuss.
Connect with me on Twitter. I'm always open to discuss.
免责声明
这些信息和出版物并非旨在提供,也不构成TradingView提供或认可的任何形式的财务、投资、交易或其他类型的建议或推荐。请阅读使用条款了解更多信息。
受保护脚本
此脚本以闭源形式发布。 但是,您可以自由使用,没有任何限制 — 了解更多信息这里。
"Even the wise cannot see all ends." - Gandalf
Connect with me on Twitter. I'm always open to discuss.
Connect with me on Twitter. I'm always open to discuss.
免责声明
这些信息和出版物并非旨在提供,也不构成TradingView提供或认可的任何形式的财务、投资、交易或其他类型的建议或推荐。请阅读使用条款了解更多信息。