PROTECTED SOURCE SCRIPT
已更新 FX4M by fx4_living
FX4M Simplified by fx4_living
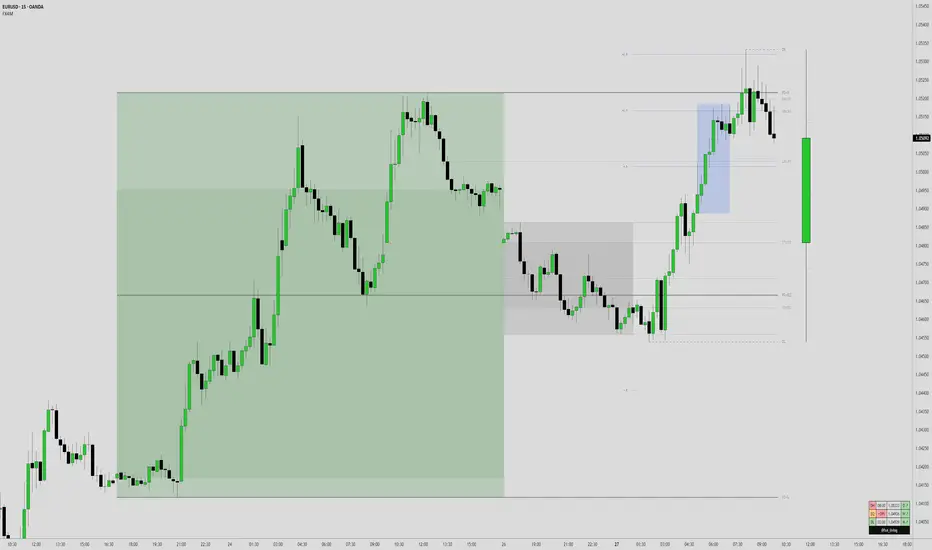
1. Previous Period Framework
Selectable Period: Prior Daily, Weekly, or Monthly.
Range Box: Full high-to-low span of the prior period, shaded by up/down close.
Body Box: Open-to-close section within the range box.
High/Low Lines: Horizontal lines at the previous period’s high/low.
Equilibrium Line: Midpoint between the previous high and low.
2. Intraday Opening Lines
Plots reference price lines for:
Daily Open
(00:00 New York) Midnight Open
09:30 AM Open
13:30 PM Open
Current-Hour Open; plus Weekly/Monthly Opens when Weekly/Monthly is selected.
Each line has its own color, style, and time/price label.
3. Intraday High/Low Tracking
Marks the current day’s highest and lowest prices.
“D-H” and “D-L” labels with time in tooltip.
4. Accumulation Range
Definition: First one-third of the selected reference period.
Shows full range (high-to-low) and body (open-to-close), shaded by up/down close.
After it ends, the Accumulation High/Low/EQ are drawn as horizontal lines.
Optional alerts mark the first time the Accumulation High or Low is reached.
5. Accumulation Range Deviation Levels
After the Accumulation period ends, horizontal levels are drawn at ±0.5, ±1.0, ±1.5 … ±3.5 of the Accumulation range size from its High/Low. Optional small labels show the level value.
Optional alerts mark the first time each deviation level is reached.
6. Previous Period Hit Detection
Marks the first time price reaches the prior period’s High, Low, or Equilibrium during the current period.
Optional alerts are possible.
7. Pre-Market Zone
Marks 05:00–06:59 New York time with a shaded box and dotted midline; color reflects up/down close. The midline can extend forward.
Displayed on intraday charts up to 15 minutes.
8. Status Table
MWD Institutional order flow (optional): shows Daily/Weekly/Monthly closes vs. their respective opens (directional arrows in colored cells).
Customizable Watermark (optional).
Enjoy
fx4_living
1. Previous Period Framework
Selectable Period: Prior Daily, Weekly, or Monthly.
Range Box: Full high-to-low span of the prior period, shaded by up/down close.
Body Box: Open-to-close section within the range box.
High/Low Lines: Horizontal lines at the previous period’s high/low.
Equilibrium Line: Midpoint between the previous high and low.
2. Intraday Opening Lines
Plots reference price lines for:
Daily Open
(00:00 New York) Midnight Open
09:30 AM Open
13:30 PM Open
Current-Hour Open; plus Weekly/Monthly Opens when Weekly/Monthly is selected.
Each line has its own color, style, and time/price label.
3. Intraday High/Low Tracking
Marks the current day’s highest and lowest prices.
“D-H” and “D-L” labels with time in tooltip.
4. Accumulation Range
Definition: First one-third of the selected reference period.
Shows full range (high-to-low) and body (open-to-close), shaded by up/down close.
After it ends, the Accumulation High/Low/EQ are drawn as horizontal lines.
Optional alerts mark the first time the Accumulation High or Low is reached.
5. Accumulation Range Deviation Levels
After the Accumulation period ends, horizontal levels are drawn at ±0.5, ±1.0, ±1.5 … ±3.5 of the Accumulation range size from its High/Low. Optional small labels show the level value.
Optional alerts mark the first time each deviation level is reached.
6. Previous Period Hit Detection
Marks the first time price reaches the prior period’s High, Low, or Equilibrium during the current period.
Optional alerts are possible.
7. Pre-Market Zone
Marks 05:00–06:59 New York time with a shaded box and dotted midline; color reflects up/down close. The midline can extend forward.
Displayed on intraday charts up to 15 minutes.
8. Status Table
- Daily High (time & price)
- Daily Equilibrium (current deviation % and price)
- Daily Low (time & price)
MWD Institutional order flow (optional): shows Daily/Weekly/Monthly closes vs. their respective opens (directional arrows in colored cells).
Customizable Watermark (optional).
Enjoy
fx4_living
版本注释
Minor update- Added: Unlimited accumulation range deviation levels (previously limited to ±3.5 deviations)
版本注释
Mid-Maximum Performance Beta Update:Some users reported run time errors above 5m timeframe on some assets like:
- NQU2025
- ESU2025
After digging deeper into what could cause this, I found a generic main issue was caused by:
Some Object Creation Frequency Speed
Which is now fixed in this update.
The script is 55% more faster than before, which is absolutely good for all FX4M users.
Hope you guys enjoy!
fx4_living
版本注释
Minor Bug Fix- Open Lines Bug
- Deviation Bug
Everything should be back like it was before.
Enjoy
fx4_living
版本注释
FX4M Indicator Minor Update: Added: Regular Trading Hours Close Horizontal Line
版本注释
FX4M Indicator Update LogVersion 2.0 - November 26, 2025
New feature:
- HTF OHLC, active by default, you can turn off if you don't need it. (15m, 1h, 4h, Daily, Weekly, Monthly)
- Display a singular large candle to the right side of the chart that actually represent the HTF candle of your choice, the practical application in trading is to see the HTF into your LTF chart.
Also include the automatically calculated specific quadrants for it:
- 25%, 50%, 75% levels computed from highest high and lowest low of selected HTF OHLC display as dotted line on the right side of the candle.
Enjoy the new update and happy holidays!
fx4_living
版本注释
Minor Following Recent Update:- Added Auto-Sync to the HTF OHLC selection (enabled by default).
Why it matters:
Auto-Sync automatically synchronizes the timeframe selection of the HTF OHLC Candle with the main FX4M timeframe (Daily, Weekly, Monthly).
This saves time by eliminating the need to manually adjust it whenever you switch FX4M timeframes.
受保护脚本
此脚本以闭源形式发布。 但是,您可以自由使用,没有任何限制 — 了解更多信息这里。
免责声明
这些信息和出版物并非旨在提供,也不构成TradingView提供或认可的任何形式的财务、投资、交易或其他类型的建议或推荐。请阅读使用条款了解更多信息。
受保护脚本
此脚本以闭源形式发布。 但是,您可以自由使用,没有任何限制 — 了解更多信息这里。
免责声明
这些信息和出版物并非旨在提供,也不构成TradingView提供或认可的任何形式的财务、投资、交易或其他类型的建议或推荐。请阅读使用条款了解更多信息。