OPEN-SOURCE SCRIPT
已更新 EMA Deviation Rebound
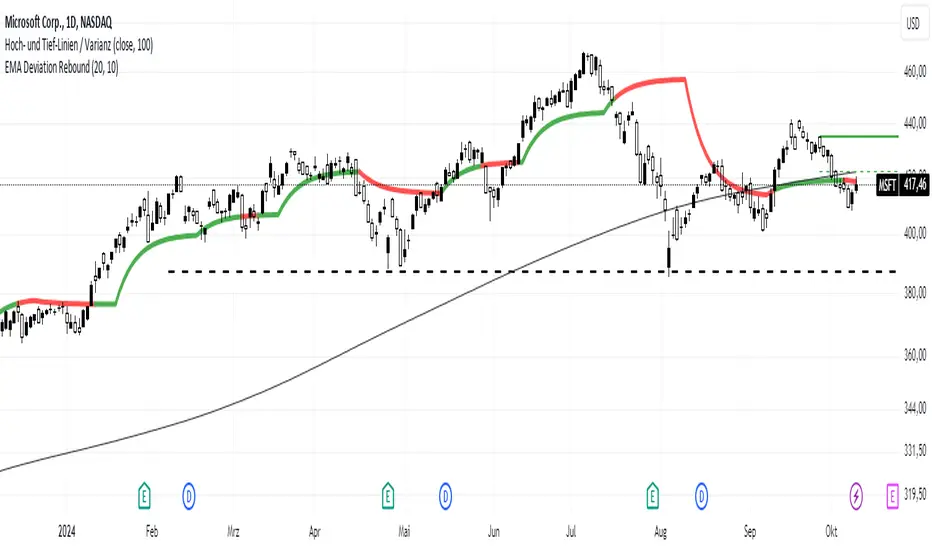
The "EMA Deviation Rebound" indicator I've created utilizes calculations involving the standard deviation of closing prices and exponential moving averages (EMA) to generate a line. The color of this line changes based on whether the EMA value is above or below the current closing price. This can be interpreted as an indicator for potential buy or sell signals:
Buy Signal: If the price crosses the indicator from bottom to top, this can be considered a buy signal. This could indicate that the price has overcome a resistance and a potential upward movement may be forthcoming.
Sell Signal: If the price crosses the indicator from top to bottom, this could serve as a sell signal. This might suggest that the price has broken a support downward and possibly indicates an impending downward movement.
The indicator is named "EMA Deviation Rebound" because I use it to identify potential resistance and support levels. When the price rebounds at the indicator, this could signify a price movement in the opposite direction.
It's important to use such indicators in conjunction with other analysis techniques and market information to make informed trading decisions.
版本注释
The indicator calculates the average of the fluctuations in the last X closing prices. This setting can be adjusted using the variable "Period." In the original version, only this value could be adjusted, and the length of the period was used for smoothing.Now, it's possible to adjust the smoothing length separately. In my opinion, this indicator works well when the line is understood as resistance or support. Often, the price tests the indicator and then moves in the opposite direction.
版本注释
The "EMA Deviation Rebound" script has now been enhanced with an alarm feature. This alarm activates whenever the color of the EMA changes, signaling potential buy or sell opportunities based on market conditions:A Buy signal (Green) is triggered when the price is above the EMA and the candle closes bullish.
A Sell signal (Red) is triggered when the price is below the EMA and the candle closes bearish.
The alarm is set to trigger only once per candle upon detecting a color change. This allows for real-time notifications, enabling better trading decisions.
开源脚本
秉承TradingView的精神,该脚本的作者将其开源,以便交易者可以查看和验证其功能。向作者致敬!您可以免费使用该脚本,但请记住,重新发布代码须遵守我们的网站规则。
免责声明
这些信息和出版物并非旨在提供,也不构成TradingView提供或认可的任何形式的财务、投资、交易或其他类型的建议或推荐。请阅读使用条款了解更多信息。
开源脚本
秉承TradingView的精神,该脚本的作者将其开源,以便交易者可以查看和验证其功能。向作者致敬!您可以免费使用该脚本,但请记住,重新发布代码须遵守我们的网站规则。
免责声明
这些信息和出版物并非旨在提供,也不构成TradingView提供或认可的任何形式的财务、投资、交易或其他类型的建议或推荐。请阅读使用条款了解更多信息。