INVITE-ONLY SCRIPT
BB Meow Mix (Lite) [acatwithwithcharts]
已更新
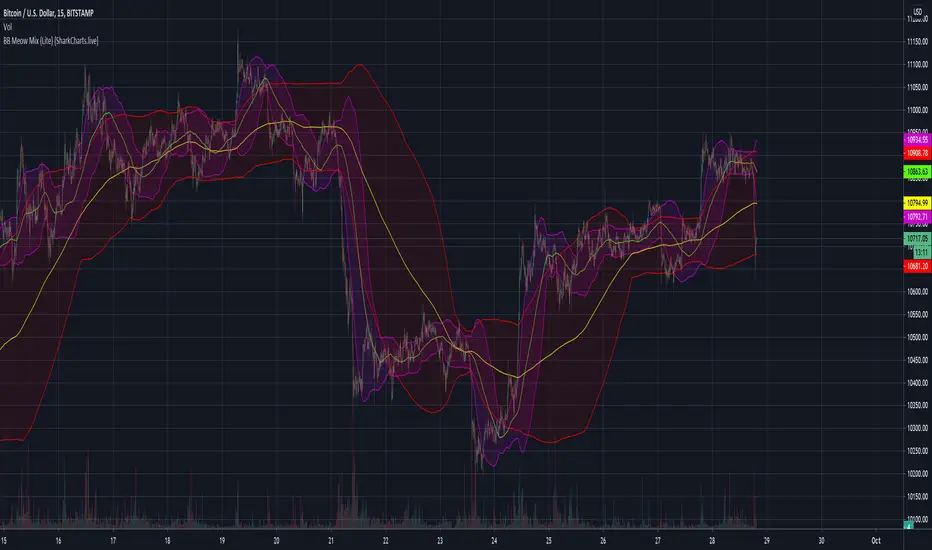
This is a stripped down, "lite" version of my BB Meow Mix script. The "lite" version is limited to using SMA and regular STDEV (ordinary BBands). It plots up to 4 custom BBands at once with a menu of built-in default period lengths and widths relevant to the strategy outlined in Mark Whistler's books "Macro to Micro" and "Volatility Illuminated".
Compared to BB Meow Mix, this script eschews a bunch of bells and whistles to create a faster-loading and more stable script for general use.
I am posting my scripts as invite-only and have a short list of collaborators in mind who will get access if they want it. It is not being made available to the general public as of this posting; I’m vaguely working towards eventually offering being able to offer some sort of paid indicator offering in the future. I’m not giving this away just to anyone who asks and will, for my own time and sanity, probably just ignore requests by people who don't come to me already knowing what this indicator does and how they might want to use it. This lite one in particular is just multiple BBands with defaults and color schemes chosen to not be indecipherable when layered over them, so I'm perhaps a lot more willing to grant requests on it.
版本注释
Adds a feature for plotting 3 additional MAs without bands.版本注释
Updated to change the attribution in the title from “acatwithcharts” to “SharkCharts.live”.I'm excited to announce that we're putting the finishing touches on a subscription service for the volatility theory indicators, and assuming no hiccups will launch them within days. Subscriptions will be available in several packages through SharkCharts.live
Current pricing and subscription details will be kept up-to-date on SharkCharts.live
版本注释
Added a default for 50/1.25, 50/2.2, 50/3.2, 200/1.25 based on some recent interest from subscribers in the SharkCharts Discord.版本注释
Based on subscriber feedback in our Discord, I've added a 1m and 15m 50/200 configuration for attempting to catch early signs of parabolic exhaustion as an additional default setting.Given that this is a particularly speculative use case using an empirical observation from cryptocurrency on micro TF charts, I think it's particularly important here to warn people if they try to use this setting that (A) it shouldn't be done without checking charts on higher timeframes to make sure they aren't missing the forest for the trees, (B) micro TF scalping needs to consider whether trades still make sense from a R:R standpoint after accounting for fees, and (C) this use case was derived from the most liquid cryptocurrencies and particularly using spread charts and indexes which artificially imply even more liquidity than truly exists, so there are some inherent assumptions of continuous trading, extremely high liquidity, and relatively high volatility.
版本注释
Realized I'd introduced a color bug on one of the defaults with my previous update - this update fixes that bug. 版本注释
Minor update to v4.版本注释
I'm making a round of updates to my scripts after testing some of the new Pinescript features and looking for ways to address loading issues that have arisen from changes over the past 6 months or so as to what thresholds cause scripts to fail on the back end. 仅限邀请脚本
仅限作者授权的用户访问此脚本,并且通常需要付费。您可以将其添加到收藏中,但是只有在向作者请求并获得许可之后,才能使用它。 请联系acatwithcharts了解更多信息,或按照以下作者的说明操作。
TradingView does not suggest paying for a script and using it unless you 100% trust its author and understand how the script works. In many cases, you can find a good open-source alternative for free in our Community Scripts.
想在图表上使用此脚本?
警告:请在申请访问权限之前阅读。
My volatility-based indicators are available for sale at SharkCharts.live
Feel free to reach out to me with any questions; more information is available on the SharkCharts website and the SharkCharts discord discord.gg/YVpTeSK
Feel free to reach out to me with any questions; more information is available on the SharkCharts website and the SharkCharts discord discord.gg/YVpTeSK
免责声明
这些信息和出版物并不意味着也不构成TradingView提供或认可的金融、投资、交易或其它类型的建议或背书。请在使用条款阅读更多信息。