OPEN-SOURCE SCRIPT
ETH vs BTC 200W SMA Overextension
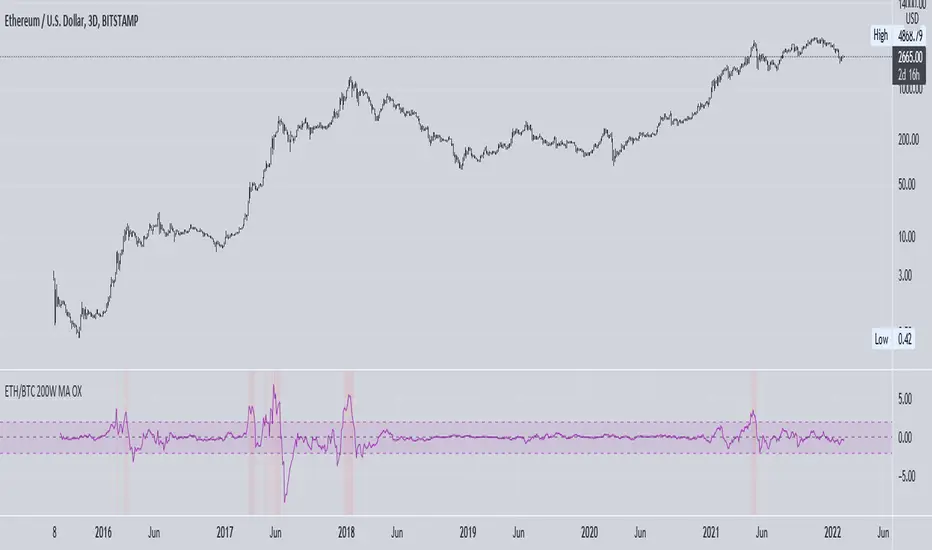
Historically, when BTC suffers a correction and ETH continues to rally, this hints at an impending market-wide correction. In Jan 2018, ETH rallies while BTC corrects, signalling the end of the bull cycle. In May 2021, ETH rallies while BTC ranges between $50-$60k, then a major correction occurs. This indicator attempts to monitor this phenomenon in order to help spot potential macro tops in the cryptocurrency market.
The indicator takes the price of the asset and divides it by the 200 week SMA value. This gives an over/undervaluation in percentage terms. When ETH becomes significantly more overvalued relative to BTC, the indicator will warn of a potential top forming (see red shaded areas).
This is for edutainment purposes only. Don't make financial decisions based on this indicator.
开源脚本
秉承TradingView的精神,该脚本的作者将其开源,以便交易者可以查看和验证其功能。向作者致敬!您可以免费使用该脚本,但请记住,重新发布代码须遵守我们的网站规则。
免责声明
这些信息和出版物并非旨在提供,也不构成TradingView提供或认可的任何形式的财务、投资、交易或其他类型的建议或推荐。请阅读使用条款了解更多信息。
免责声明
这些信息和出版物并非旨在提供,也不构成TradingView提供或认可的任何形式的财务、投资、交易或其他类型的建议或推荐。请阅读使用条款了解更多信息。