OPEN-SOURCE SCRIPT
Taiwan Pagoda Chart (Triple)
The code is open-source.
======================
Indicator Name
Taiwan Pagoda Chart
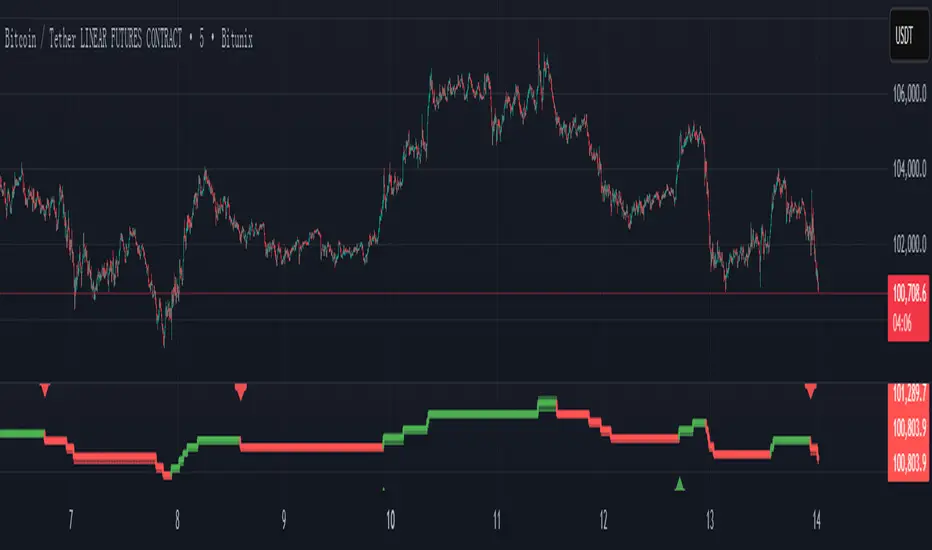
This is a technical analysis charting method similar to candlesticks but with different logic, designed to filter market noise and identify trend reversal points.
Key Features
Dynamic Pagoda Line Plotting
Unlike traditional candlesticks that plot every bar, the Pagoda line only updates when the price breaks above the previous high or below the previous low by a certain threshold.
Bullish (rising) bars are shown in green; bearish (falling) bars in red.
Multiple Optional Filters
T-value filter: Sets a minimum price change threshold to avoid signals from minor fluctuations.
Price percentage filter: Dynamically adjusts sensitivity based on a percentage of the previous Pagoda bar’s range.
ATR volatility filter: Uses Average True Range (ATR) to widen the threshold during high volatility and tighten it during low volatility.
Visual Design
Semi-transparent Pagoda structure for better visual context.
A bold central trend line to clearly show the underlying market direction.
Trading Signal Alerts
Bullish reversal (turning green): Potential buy signal.
Bearish reversal (turning red): Potential sell signal.
Optional on-chart labels (B / S) and support for TradingView alert notifications.
Highly Customizable
Users can freely adjust colors, line width, filtering rules, and signal visibility—making it adaptable to various trading styles.
Ideal Use Cases
Trend following
Reducing false breakouts
Helping medium-to-long-term traders identify high-probability entry and exit points
======================
Indicator Name
Taiwan Pagoda Chart
This is a technical analysis charting method similar to candlesticks but with different logic, designed to filter market noise and identify trend reversal points.
Key Features
Dynamic Pagoda Line Plotting
Unlike traditional candlesticks that plot every bar, the Pagoda line only updates when the price breaks above the previous high or below the previous low by a certain threshold.
Bullish (rising) bars are shown in green; bearish (falling) bars in red.
Multiple Optional Filters
T-value filter: Sets a minimum price change threshold to avoid signals from minor fluctuations.
Price percentage filter: Dynamically adjusts sensitivity based on a percentage of the previous Pagoda bar’s range.
ATR volatility filter: Uses Average True Range (ATR) to widen the threshold during high volatility and tighten it during low volatility.
Visual Design
Semi-transparent Pagoda structure for better visual context.
A bold central trend line to clearly show the underlying market direction.
Trading Signal Alerts
Bullish reversal (turning green): Potential buy signal.
Bearish reversal (turning red): Potential sell signal.
Optional on-chart labels (B / S) and support for TradingView alert notifications.
Highly Customizable
Users can freely adjust colors, line width, filtering rules, and signal visibility—making it adaptable to various trading styles.
Ideal Use Cases
Trend following
Reducing false breakouts
Helping medium-to-long-term traders identify high-probability entry and exit points
开源脚本
秉承TradingView的精神,该脚本的作者将其开源,以便交易者可以查看和验证其功能。向作者致敬!您可以免费使用该脚本,但请记住,重新发布代码须遵守我们的网站规则。
免责声明
这些信息和出版物并非旨在提供,也不构成TradingView提供或认可的任何形式的财务、投资、交易或其他类型的建议或推荐。请阅读使用条款了解更多信息。
开源脚本
秉承TradingView的精神,该脚本的作者将其开源,以便交易者可以查看和验证其功能。向作者致敬!您可以免费使用该脚本,但请记住,重新发布代码须遵守我们的网站规则。
免责声明
这些信息和出版物并非旨在提供,也不构成TradingView提供或认可的任何形式的财务、投资、交易或其他类型的建议或推荐。请阅读使用条款了解更多信息。