PROTECTED SOURCE SCRIPT
已更新 ZN Pivots
Description
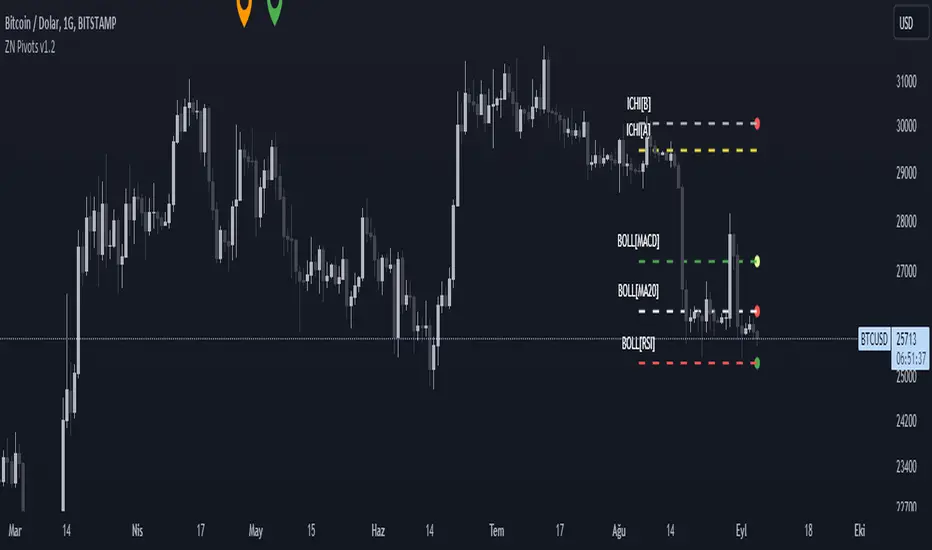
This indicator is aimed at showing the pivot points of the trend by using Ichimoku cloud and Bollinger bands.
Warning
As a result, this indicator should be expected to give an idea of the trend direction, not a trading signal.
Version
v1.0
This indicator is aimed at showing the pivot points of the trend by using Ichimoku cloud and Bollinger bands.
- BOLL[MACD]: Upper Bollinger Band. The red circle formed on it refers to the downward intersection of the MACD indicator. In the downward intersection, a red circle appears.
- BOLL[MA20]: Middle Bollinger Band.
- BOLL[RSI]: Lower Bollinger Band. The red circle formed on it refers to the downward intersection of the RSI indicator. In the downward intersection, a red circle appears.
- ICHI[A]: Ichimoku Leading A Line. The green circle formed on it refers to the upward intersection of the ICHIMOKU indicator.
- ICHI[B]: Ichimoku Leading B Line. The red circle formed on it refers to the downward intersection of the ICHIMOKU indicator.
Warning
As a result, this indicator should be expected to give an idea of the trend direction, not a trading signal.
Version
v1.0
版本注释
- [ADDED] If the price closes below the middle band, a red circle is now displayed on the middle band. Otherwise, you will see a green circle.
- [CHANGED] the colors of the upper bollinger band line and the lower band line.
版本注释
- The red circle that occurs when the Ichimoku leading A line cuts down the leading B line is now displayed on the leading B.
- Fixed the issue of contraction on large time frames caused by Bollinger lower band calculation.
版本注释
- Plot plots showing indicator levels have been replaced with line plots.
- Line width increased from 10 bars to 30 bars.
受保护脚本
此脚本以闭源形式发布。 但是,您可以自由使用,没有任何限制 — 了解更多信息这里。
免责声明
这些信息和出版物并非旨在提供,也不构成TradingView提供或认可的任何形式的财务、投资、交易或其他类型的建议或推荐。请阅读使用条款了解更多信息。
受保护脚本
此脚本以闭源形式发布。 但是,您可以自由使用,没有任何限制 — 了解更多信息这里。
免责声明
这些信息和出版物并非旨在提供,也不构成TradingView提供或认可的任何形式的财务、投资、交易或其他类型的建议或推荐。请阅读使用条款了解更多信息。