PROTECTED SOURCE SCRIPT
已更新 Market Sentiment Composite Index
Description
The Market Sentiment Composite Index is an advanced indicator designed to provide traders with a comprehensive view of market sentiment by aggregating data from multiple key indicators. This tool helps traders identify potential overbought and oversold conditions, enabling more informed trading decisions.
How It Works
Indicator Components:
Relative Strength Index (RSI): Measures the magnitude of recent price changes to evaluate overbought or oversold conditions.
Average True Range (ATR): Gauges market volatility by analyzing the range of price movements.
MACD (Moving Average Convergence Divergence): Indicates momentum and potential buy/sell signals based on moving average crossovers.
Volume Score: Assesses trading volume in relation to its historical average to detect unusual activity.
Normalization: Each component is normalized to a 0-100 scale, ensuring consistency across different metrics.
Composite Calculation: The normalized values are averaged to form the Composite Sentiment Score. This score ranges from 0 to 100, providing a unified measure of market sentiment.
Visual Representation:
Sentiment Score Plot: The composite sentiment score is plotted on the chart.
Overbought/Oversold Levels: Default levels set at 70 (overbought) and 30 (oversold), customizable by the user.
Horizontal Lines: Dashed lines at the overbought and oversold levels for easy reference.
Alerts: Custom alerts notify traders when the sentiment score crosses the overbought or oversold thresholds, helping them stay informed of significant market conditions.
Usage
The Market Sentiment Composite Index is ideal for traders who seek a holistic view of market sentiment. By combining multiple indicators into a single score, it provides a robust tool to identify potential reversal points and confirm trends.
Key Benefits
Comprehensive Insight: Integrates multiple indicators for a well-rounded sentiment analysis.
Customization: Adjustable overbought and oversold levels to fit individual trading strategies.
User-Friendly: Clear visual representation and alerts to keep traders informed..
版本注释
Market Sentiment Composite IndexDescription: The Market Sentiment Composite Index (MSCI) is an innovative tool designed to provide traders with a comprehensive view of market sentiment by combining multiple well-known indicators: RSI, ATR, MACD, and Volume. Unlike individual indicators, MSCI integrates these components to offer a more robust sentiment analysis, helping traders make more informed decisions.
Key Features and Components:
Relative Strength Index (RSI): The RSI is used to measure the speed and change of price movements. It helps identify overbought and oversold conditions, indicating potential reversal points.
Average True Range (ATR): The ATR measures market volatility. High ATR values indicate high volatility, while low values indicate low volatility. This helps traders understand the risk level in the market.
Moving Average Convergence Divergence (MACD): The MACD is a trend-following momentum indicator that shows the relationship between two moving averages of a security’s price. It helps identify trend direction and strength.
Volume Score: Volume is a crucial indicator of market strength. The volume score normalizes current volume against the 20-period moving average, providing insights into the activity level and confirming price movements.
How It Works:
Normalization: Each indicator is normalized to a 0-100 range to create a comparable composite score. This ensures that no single component disproportionately influences the overall sentiment index.
Composite Score Calculation: The normalized scores of RSI, ATR, MACD, and Volume are averaged to produce the Market Sentiment Composite Index. This composite score reflects the overall market sentiment, with values above 70 indicating overbought conditions and values below 30 indicating oversold conditions.
Usage:
Overbought and Oversold Levels: Customizable overbought and oversold levels allow traders to set thresholds that align with their trading strategy. The default levels are set to 70 (overbought) and 30 (oversold).
Alerts: The script generates alerts when the composite score crosses the overbought or oversold thresholds, helping traders stay informed about potential market reversals.
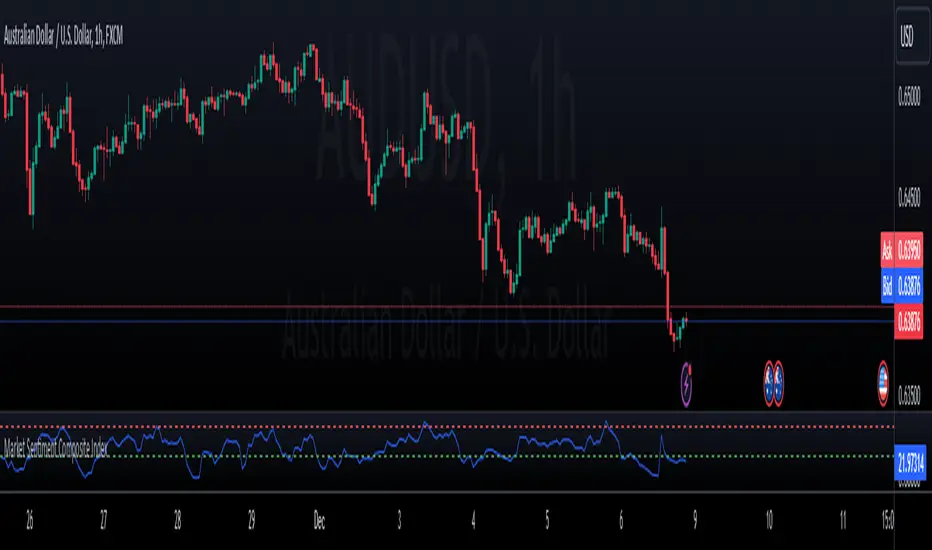
Example:
The example chart demonstrates the MSCI plotted below the price chart, with the zero line for reference and the composite score highlighted..
受保护脚本
此脚本以闭源形式发布。 但是,您可以自由使用,没有任何限制 — 了解更多信息这里。
免责声明
这些信息和出版物并非旨在提供,也不构成TradingView提供或认可的任何形式的财务、投资、交易或其他类型的建议或推荐。请阅读使用条款了解更多信息。
免责声明
这些信息和出版物并非旨在提供,也不构成TradingView提供或认可的任何形式的财务、投资、交易或其他类型的建议或推荐。请阅读使用条款了解更多信息。