INVITE-ONLY SCRIPT
Specific Bar Volume Ratio
已更新
Simple.
NYSE only.
0930am-1130am only.
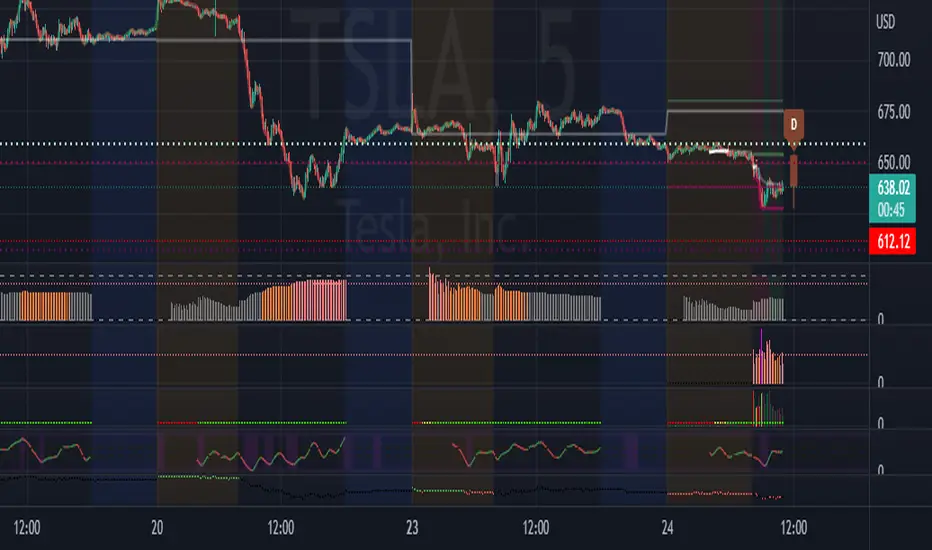
The colors are based on the popular Zanger Ratio.
The code compares the current volume (5m candles) to the average of precisely the same candle on the same day over the past 20 trading days.
Below 60 = drying up / low (grey)
Above 60 = below average (orange)
Above 80 = average (pink)
Above 120 = High (magenta)
Above 200 = Extreme (red)
The example you see is in Central time.
Contact me if you are interested.
NYSE only.
0930am-1130am only.
The colors are based on the popular Zanger Ratio.
The code compares the current volume (5m candles) to the average of precisely the same candle on the same day over the past 20 trading days.
Below 60 = drying up / low (grey)
Above 60 = below average (orange)
Above 80 = average (pink)
Above 120 = High (magenta)
Above 200 = Extreme (red)
The example you see is in Central time.
Contact me if you are interested.
版本注释
Cleaned up code.仅限邀请脚本
仅限作者授权的用户访问此脚本,并且通常需要付费。您可以将其添加到收藏中,但是只有在向作者请求并获得许可之后,才能使用它。 请联系kmack282了解更多信息,或按照以下作者的说明操作。
TradingView does not suggest paying for a script and using it unless you 100% trust its author and understand how the script works. In many cases, you can find a good open-source alternative for free in our Community Scripts.
想在图表上使用此脚本?
警告:请在申请访问权限之前阅读。
免责声明
这些信息和出版物并不意味着也不构成TradingView提供或认可的金融、投资、交易或其它类型的建议或背书。请在使用条款阅读更多信息。