OPEN-SOURCE SCRIPT
EVWMA Acc/Dist. Pressure & FRACTAL BANDS by @XeL_Arjona
EVWMA ACCUMULATION/DISTRIBUTION PRESSURE & FRACTAL BANDS
Version: 3.0 @ 4.11.2015
By Ricardo M Arjona xel_arjona
DISCLAIMER:
The following indicator IS NOT INTENDED TO BE A FORMAL INVESTMENT ADVICE OR TRADING RECOMMENDATION BY THE AUTHOR, nor should be construed as such. Users will be fully responsible by their use regarding any kind of trading vehicles or assets.
The following script and ideas within this work are FREELY AND PUBLICLY availables on the Web for NON LUCRATIVE ACTIVITIES and must remain as is.
-== IMPORTANT: THIS IS AN EXPERIMENTAL INDICATOR ==-
What is this?
This work is a derivation of my previous Accumulation/Distribution scripts publicly available in TradingView in an effort to clean, speedup and make the indicator cleaner as possible.
The current indicator is based on already tested and Mathematically proof concepts as described below:
ALL NEW IDEAS OR MODIFICATIONS to this indicator are welcome in favor to deploy a better technical tool. Any important addition to this work MUST REMAIN PUBLIC by means of CreativeCommons CC & TradingView user rules. (C) 2015 xel_arjona
Version: 3.0 @ 4.11.2015
By Ricardo M Arjona xel_arjona
DISCLAIMER:
The following indicator IS NOT INTENDED TO BE A FORMAL INVESTMENT ADVICE OR TRADING RECOMMENDATION BY THE AUTHOR, nor should be construed as such. Users will be fully responsible by their use regarding any kind of trading vehicles or assets.
The following script and ideas within this work are FREELY AND PUBLICLY availables on the Web for NON LUCRATIVE ACTIVITIES and must remain as is.
-== IMPORTANT: THIS IS AN EXPERIMENTAL INDICATOR ==-
What is this?
This work is a derivation of my previous Accumulation/Distribution scripts publicly available in TradingView in an effort to clean, speedup and make the indicator cleaner as possible.
The current indicator is based on already tested and Mathematically proof concepts as described below:
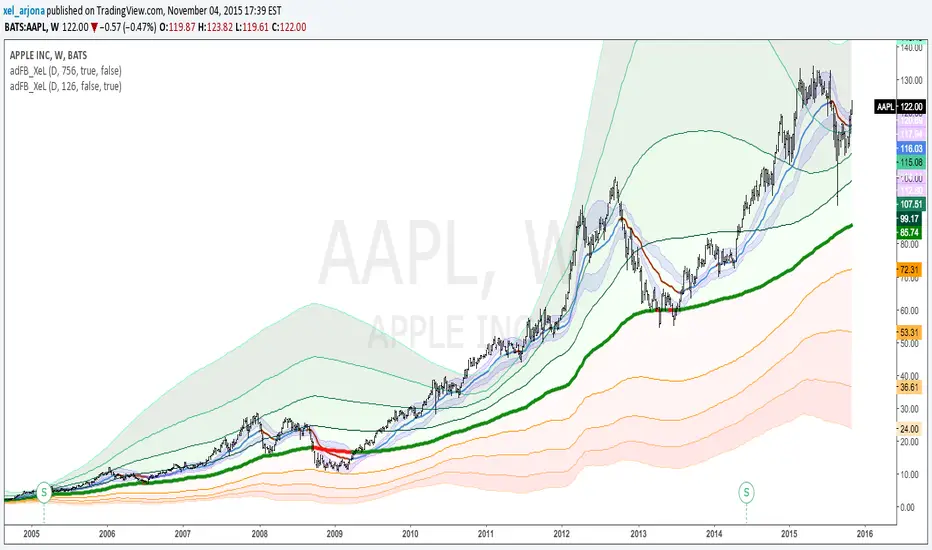
- The MAIN Rolling back median line or "Vortex" is constructed by a simple and equal weighting of distributed volume along the candle range (This approach is just an "estimator" of Buyers Vs. Sellers given the lack of tick resolution in TradingView, a real "DELTA" can only be 100% reliable with Market Depth (Ask/Bid ticks)), Given this, with each "volume weights", the price is post-processed against a true statistical Average calculation formerly: ELASTIC VOLUME WEIGHTED MOVING AVERAGE.
- The FRACTAL BANDS are just Standard Deviation's with GOLDEN RATIO as multiplier (1.618) derived one from each other within it's origin on the former "Vortex Median".
- The Standard Error Bands comply as the original indicator described by Jon Andersen but given the true statistical nature of EVWMA, the original LinReg line has been substituted by the former.
ALL NEW IDEAS OR MODIFICATIONS to this indicator are welcome in favor to deploy a better technical tool. Any important addition to this work MUST REMAIN PUBLIC by means of CreativeCommons CC & TradingView user rules. (C) 2015 xel_arjona
开源脚本
秉承TradingView的精神,该脚本的作者将其开源,以便交易者可以查看和验证其功能。向作者致敬!您可以免费使用该脚本,但请记住,重新发布代码须遵守我们的网站规则。
免责声明
这些信息和出版物并非旨在提供,也不构成TradingView提供或认可的任何形式的财务、投资、交易或其他类型的建议或推荐。请阅读使用条款了解更多信息。
开源脚本
秉承TradingView的精神,该脚本的作者将其开源,以便交易者可以查看和验证其功能。向作者致敬!您可以免费使用该脚本,但请记住,重新发布代码须遵守我们的网站规则。
免责声明
这些信息和出版物并非旨在提供,也不构成TradingView提供或认可的任何形式的财务、投资、交易或其他类型的建议或推荐。请阅读使用条款了解更多信息。