OPEN-SOURCE SCRIPT
已更新 3 Day Lookback [TFO]

This 3 Day Lookback indicator aims to display key information about price with respect to its previous 3 day highs and lows. It was built with the intention of being compact in order to not take up a lot of chart space.
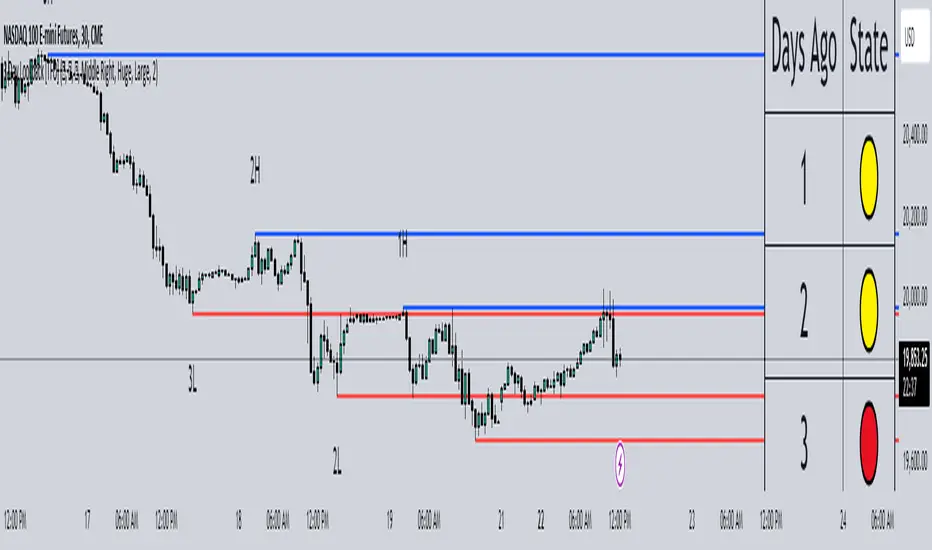
The core component of this indicator is the table. From this table, we look at price with respect to the ranges from 1, 2, and 3 days ago, and assign it a color code. By default, we use 🟢, 🟡, and 🔴 to indicate that price is above, stuck inside, or below these ranges, respectively.
Take the following chart as an example. We manually drew these boxes to encompass the range of each day, from high to low. The leftmost box from 3 days ago is colored red to reflect the fact that price is below that day's low. This is why the table indicates a state of 🔴 for the range from 3 days ago. Then, the following two days are colored yellow to indicate that price is currently trading inside their ranges, which is why the state for both of those days is indicated as 🟡 in the table.

In a similar example below, we can see that price is clearly above the high from 3 days ago and the high from 2 days ago, which is reflected in the table with a state of 🟢 for both. However, since price is currently trading within the range from 1 day ago, it is assigned a state of 🟡 in the table.

As you may have noticed in the above examples, each day's high and low is indicated with labels (ex. "2H" and "2L" for the high and low from 2 days ago). These are optional and can be turned off in the indicator's settings. The lines tracking the previous 3 day highs and lows may also be turned off so that you're just left with the table, as is shown in the below example.

With this minimalistic table, users can get a quick glance at how price is trading with respect to the last few days of price action. Hopefully this proves useful for mobile users as well, since the indicator can be reduced to a simple table that doesn't take up much chart space.
The core component of this indicator is the table. From this table, we look at price with respect to the ranges from 1, 2, and 3 days ago, and assign it a color code. By default, we use 🟢, 🟡, and 🔴 to indicate that price is above, stuck inside, or below these ranges, respectively.
Take the following chart as an example. We manually drew these boxes to encompass the range of each day, from high to low. The leftmost box from 3 days ago is colored red to reflect the fact that price is below that day's low. This is why the table indicates a state of 🔴 for the range from 3 days ago. Then, the following two days are colored yellow to indicate that price is currently trading inside their ranges, which is why the state for both of those days is indicated as 🟡 in the table.
In a similar example below, we can see that price is clearly above the high from 3 days ago and the high from 2 days ago, which is reflected in the table with a state of 🟢 for both. However, since price is currently trading within the range from 1 day ago, it is assigned a state of 🟡 in the table.
As you may have noticed in the above examples, each day's high and low is indicated with labels (ex. "2H" and "2L" for the high and low from 2 days ago). These are optional and can be turned off in the indicator's settings. The lines tracking the previous 3 day highs and lows may also be turned off so that you're just left with the table, as is shown in the below example.
With this minimalistic table, users can get a quick glance at how price is trading with respect to the last few days of price action. Hopefully this proves useful for mobile users as well, since the indicator can be reduced to a simple table that doesn't take up much chart space.
版本注释
- Changed the label notation, for example "H2" is now "2H"- Added an option to display labels on the right
- Added label tooltips to display their prices
- Removed the infinite extension of levels to the right-hand side of the chart (anchored to the current bar instead)
开源脚本
秉承TradingView的精神,该脚本的作者将其开源,以便交易者可以查看和验证其功能。向作者致敬!您可以免费使用该脚本,但请记住,重新发布代码须遵守我们的网站规则。
免责声明
这些信息和出版物并非旨在提供,也不构成TradingView提供或认可的任何形式的财务、投资、交易或其他类型的建议或推荐。请阅读使用条款了解更多信息。
开源脚本
秉承TradingView的精神,该脚本的作者将其开源,以便交易者可以查看和验证其功能。向作者致敬!您可以免费使用该脚本,但请记住,重新发布代码须遵守我们的网站规则。
免责声明
这些信息和出版物并非旨在提供,也不构成TradingView提供或认可的任何形式的财务、投资、交易或其他类型的建议或推荐。请阅读使用条款了解更多信息。