PROTECTED SOURCE SCRIPT
S&P 500 Long Only Investment Strategy, Achernar (by ChartArt)
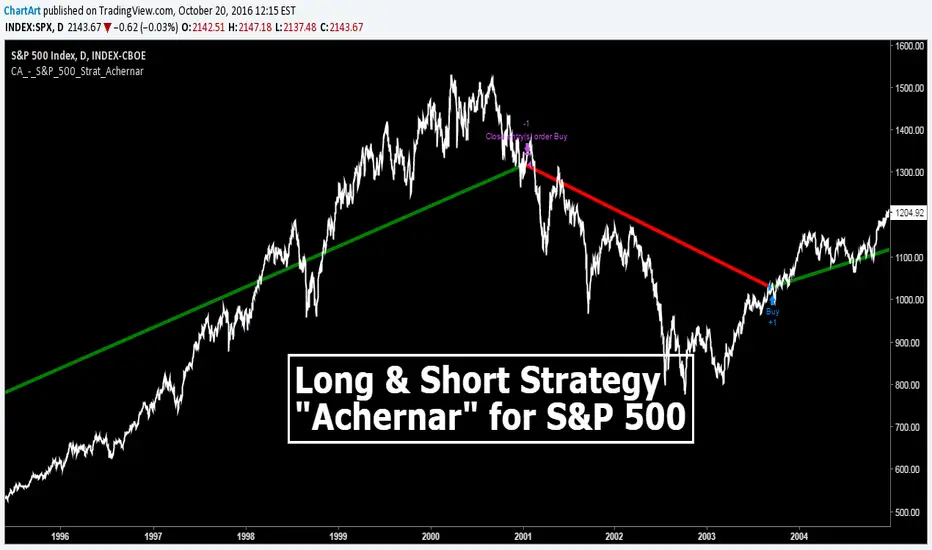
Here is my strategy with the working title "Achernar", which works best with the published default setting on the 'CBOE' 'S&P 500' daily chart. The strategy is intended for investments in long-term time-frames (the current average of the trades is a holding period of over 1000 days). The setting allows to use the 'CBOE' as price source (default) or the Tradingview TVC index, which uses a 'CFD' of the 'S&P 500' as price source. Please beware that there is a typo: This strategy does not go short, it closes the long trades and goes into cash instead, therefore this is a long only strategy.
If you don't want to lose all your money due to some random strategy you found on the Internet, here is a warning:
All trading involves high risk; past performance is not necessarily indicative of future results. Hypothetical or simulated performance results have certain inherent limitations. Unlike an actual performance record, simulated results do not represent actual trading. Also, since the trades have not actually been executed, the results may have under- or over-compensated for the impact, if any, of certain market factors, such as lack of liquidity. Simulated trading programs in general are also subject to the fact that they are designed with the benefit of hindsight. No representation is being made that any account will or is likely to achieve profits or losses similar to those shown.
P.S. The published script does not show the other trade entries on the screenshot above. Here is how the strategy looks like on the chart:
受保护脚本
此脚本以闭源形式发布。 However, you can use it freely and without any limitations – learn more here.
免责声明
The information and publications are not meant to be, and do not constitute, financial, investment, trading, or other types of advice or recommendations supplied or endorsed by TradingView. Read more in the Terms of Use.