OPEN-SOURCE SCRIPT
已更新 Current Hourly Open Liquidity with Sweep Detection
Statistics indicate that if the current hourly candle reaches the high or low of the previous hourly candle, there is a strong likelihood that the price will return to the current hour's open, depending on how quickly the previous hour's high or low was swept. If the sweep occurs within the first 20 minutes, there is a 75% chance the current hour's open will be reached; if it takes between 21 and 40 minutes, the probability decreases to 50%; and if it takes longer than 41 minutes, the chance drops to 25%.
These statistics can help identify manipulation on the hourly timeframe and guide trade decisions accordingly. For instance, if the previous hourly high is taken within the first 20 minutes but the current hour's open is not reached, it may be wise to avoid long positions until it happens or consider short positions in the direction of the open liquidity, using your existing entry rules and risk management.
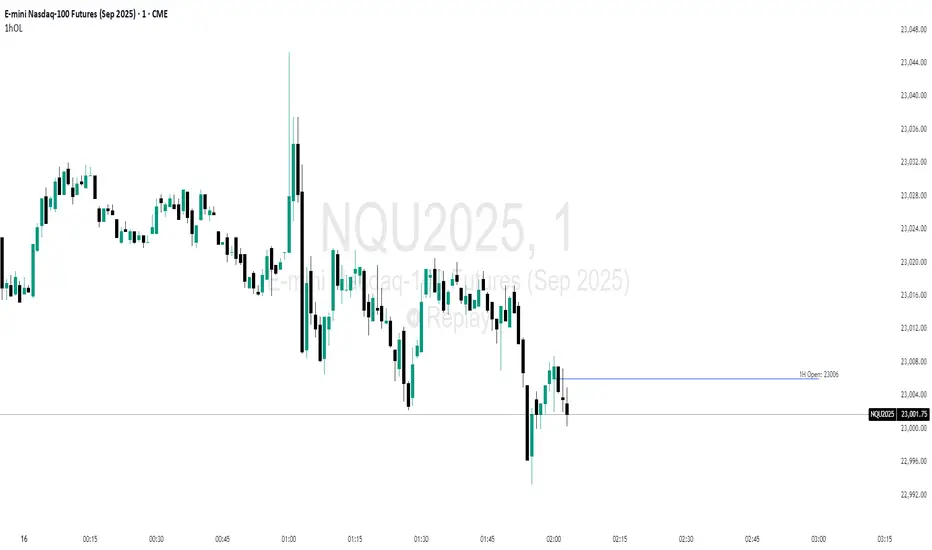
The indicator highlights the current hour's open with a line and label to visually represent that liquidity pool, adjusting the line's color based on whether and when the previous hour's high or low was tapped. Once the open is reached, the indicator can, depending on settings, remove the line and label from the chart (this is enabled by default) since the liquidity pool is no longer relevant, preventing chart clutter.
All colors, line widths, label text sizes, and colors can be customized.
These statistics can help identify manipulation on the hourly timeframe and guide trade decisions accordingly. For instance, if the previous hourly high is taken within the first 20 minutes but the current hour's open is not reached, it may be wise to avoid long positions until it happens or consider short positions in the direction of the open liquidity, using your existing entry rules and risk management.
The indicator highlights the current hour's open with a line and label to visually represent that liquidity pool, adjusting the line's color based on whether and when the previous hour's high or low was tapped. Once the open is reached, the indicator can, depending on settings, remove the line and label from the chart (this is enabled by default) since the liquidity pool is no longer relevant, preventing chart clutter.
All colors, line widths, label text sizes, and colors can be customized.
版本注释
Added ability to disable label by setting label template to an empty stringYou can now also control label text, which allows inclusion of {{price}} - hourly open and {{time}} of the hourly candle (i.e. 12pm)
版本注释
Added ability to control line style for hourly open版本注释
Fixed time to be in short Am/Pm format版本注释
Fine-tunning label position版本注释
The original breakdown of hour into 3 oversimplified zones proved to be incorrect based on actual data analysis explained in full on Twitter(X). I ran my own data analysis, examined 15 years of hourly candlestick data and came up with specific hourly thresholds that are actually representative of price action.
The colors are now assigned according to those values and depend on each hour.
版本注释
Added missing hours开源脚本
秉承TradingView的精神,该脚本的作者将其开源,以便交易者可以查看和验证其功能。向作者致敬!您可以免费使用该脚本,但请记住,重新发布代码须遵守我们的网站规则。
免责声明
这些信息和出版物并非旨在提供,也不构成TradingView提供或认可的任何形式的财务、投资、交易或其他类型的建议或推荐。请阅读使用条款了解更多信息。
开源脚本
秉承TradingView的精神,该脚本的作者将其开源,以便交易者可以查看和验证其功能。向作者致敬!您可以免费使用该脚本,但请记住,重新发布代码须遵守我们的网站规则。
免责声明
这些信息和出版物并非旨在提供,也不构成TradingView提供或认可的任何形式的财务、投资、交易或其他类型的建议或推荐。请阅读使用条款了解更多信息。