INVITE-ONLY SCRIPT
TradeChartist Vitality
已更新

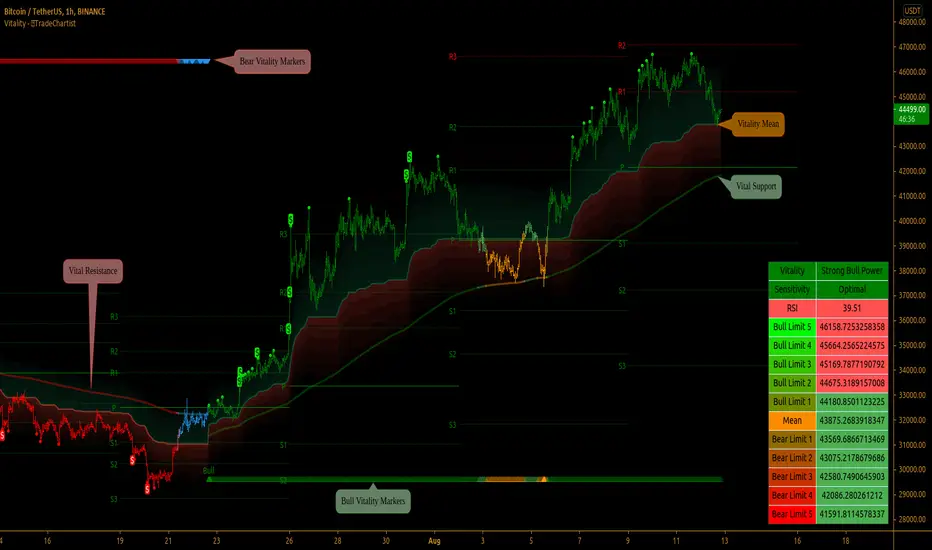
™TradeChartist Vitality is a visual indicator that uses both Mean Reversion and Trend Following models to visually show the vitality of Bulls and Bears on chart based on only one factor - Sensitivity in relation to the Vital Support/Resistance derived from the Vitality Bands, Price Momentum and Volatility.
===================================================================================================================
™TradeChartist Vitality Features:
=============================
Long - Alerts when Bull signal is generated. Use Once Per Bar Close
Long Take Profit - Alerts when $ signs are plotted during Bull Zone. Use Once Per Bar
Short - Alerts when Bear signal is generated. Use Once Per Bar Close
Short Take Profit - Alerts when $ signs are plotted during Bear Zone. Use Once Per Bar
Test of Mean - Alerts when price tests the Volatizer Mean line. Use Once Per Bar
Note: The script doesn't repaint, so the alerts can be used with confidence. To check this, users can do bar replay to check if the plots and markers stay in the same place.
===================================================================================================================
The indicator can be used for trade entries with filter combinations or can be used as standalone Visualizer for trend confirmations, levels etc.
===================================================================================================================
Best Practice: Test with different settings first using Paper Trades before trading with real money
===================================================================================================================
===================================================================================================================
™TradeChartist Vitality Features:
=============================
- Vitality Bands comprising of Vitality Mean and 5 Bull/Bear Limits. These are determined using the user defined Sensitivity from the settings (Very Low, Low, Optimal, High). Higher the sensitivity, shorter the trend and lower the Risk/Reward ratio.
- Vital Support and Resistance that decide the Bull and Bear Vitality using colour coded markers on top and bottom of the chart, based on the trend.
- Information table that shows the Bull/Bear Vitality, RSI and Price information of the Vitality Mean, Bull Limits 1-5 and Bear Limits 1-5. These prices are colour coded green or red based on the real time closing price trading above or below.
- Bull and Bear markers appear after the confirmation of the trend change at the start of the trend.
- Option to plot Pivot Points (Traditional and Fibonacci) automatically or based on user defined time frame. These are really helpful in determining the developing price dynamic based on Ranging/Squeezing/Expanding Pivot Points.
- Bar Colouring based on Bull/Bear Vitality.
- 4 Colour Themes for the Bands visuals.
- $ signs to help users spot potential zones to Take Profit/Move SL. The $ signs appear above/below the price bars based on the trend at zones of potential price exhaustion, critical support/resistance and other factors.
- Vitality Bands Transparency adjustment and Custom colour option for Pivot Points.
- Alerts can be created for the following.
Long - Alerts when Bull signal is generated. Use Once Per Bar Close
Long Take Profit - Alerts when $ signs are plotted during Bull Zone. Use Once Per Bar
Short - Alerts when Bear signal is generated. Use Once Per Bar Close
Short Take Profit - Alerts when $ signs are plotted during Bear Zone. Use Once Per Bar
Test of Mean - Alerts when price tests the Volatizer Mean line. Use Once Per Bar
Note: The script doesn't repaint, so the alerts can be used with confidence. To check this, users can do bar replay to check if the plots and markers stay in the same place.
===================================================================================================================
The indicator can be used for trade entries with filter combinations or can be used as standalone Visualizer for trend confirmations, levels etc.
===================================================================================================================
Best Practice: Test with different settings first using Paper Trades before trading with real money
===================================================================================================================
版本注释
Code update : Table Position and Table Size options in settings版本注释
Code Optimised版本注释
Code optimised仅限邀请脚本
仅限作者授权的用户访问此脚本,并且通常需要付费。您可以将其添加到收藏中,但是只有在向作者请求并获得许可之后,才能使用它。 请联系TradeChartist了解更多信息,或按照以下作者的说明操作。
TradingView不建议付费使用脚本,除非您100%信任作者并了解脚本的工作原理。在许多情况下,您可以在我们的社区脚本免费找到不错的开源替代方案。
作者的说明
″Get in touch with me via Private Message to request trial access to the Invite-only scripts and for more information.
想在图表上使用此脚本?
警告:请在申请访问权限之前阅读。
Get in touch with me if you would like access to my Premium scripts for a trial before deciding on lifetime access.
Telegram - @Trade_Chartist
Free Scripts - bit.ly/Free-Scripts
Telegram - @Trade_Chartist
Free Scripts - bit.ly/Free-Scripts
免责声明
这些信息和出版物并不意味着也不构成TradingView提供或认可的金融、投资、交易或其它类型的建议或背书。请在使用条款阅读更多信息。