OPEN-SOURCE SCRIPT
Common Volume Spike Indicator with Price Color on Spike
Indicator Name: Common Volume Spike Indicator with Price Color on Spike
Description:
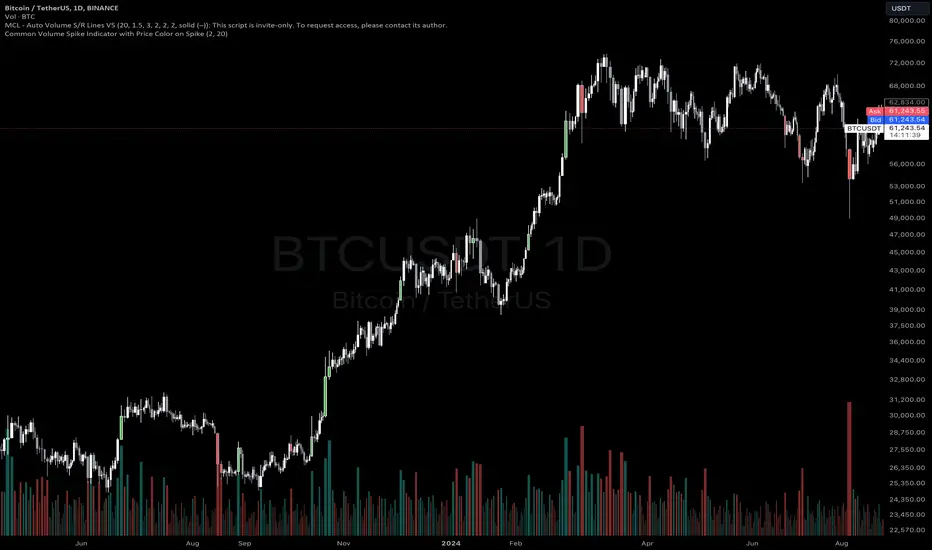
The “Common Volume Spike Indicator with Price Color on Spike” is designed to detect significant volume spikes and highlight them on the chart. It not only identifies moments when the trading volume exceeds a certain threshold but also colors the price bars based on price movement during these spikes.
Key Features:
• Volume Spike Detection: Detects volume spikes when the current volume exceeds a specified multiple of the average volume over a user-defined lookback period.
• Dynamic Volume Break: Highlights bars where the volume exceeds a threshold, dynamically calculated as a multiple of the average volume (default is 10x the average volume).
• Price Color on Volume Spike: When a volume spike occurs, bars are colored green if the price closes higher than the previous bar, and red if the price closes lower. This feature helps traders easily identify significant price movements during high-volume periods.
• Customizable Parameters:
• Threshold Multiplier: Adjust the sensitivity of volume spike detection.
• Lookback Period: Define the period over which the average volume is calculated.
• Volume Break Multiplier: Set a multiplier for the average volume to identify extreme volume breaks.
This indicator is suitable for traders who want to quickly spot critical market events driven by significant increases in volume. It helps to visualize both the volume activity and the corresponding price movement, providing an additional layer of market insight.
How to Use:
1. Green Bars: When the volume spike condition is met and the price closes higher than the previous bar, the bar is colored green.
2. Red Bars: When the volume spike condition is met and the price closes lower than the previous bar, the bar is colored red.
3. Blue Bars: Indicates a significant volume break, where the current volume exceeds a specified multiple of the average volume (default: 10x).
Ideal for intraday and swing traders who rely on volume and price action for market entries and exits. This indicator works well across different asset classes, including stocks, forex, and cryptocurrencies.
You can adjust the input parameters to fit your specific trading strategy and timeframe.
Disclaimer: This indicator is a tool to help with market analysis and should not be considered financial advice. Always perform your own due diligence before making any trading decisions.
This description outlines the key functionality and how the indicator can benefit traders on TradingView.
Description:
The “Common Volume Spike Indicator with Price Color on Spike” is designed to detect significant volume spikes and highlight them on the chart. It not only identifies moments when the trading volume exceeds a certain threshold but also colors the price bars based on price movement during these spikes.
Key Features:
• Volume Spike Detection: Detects volume spikes when the current volume exceeds a specified multiple of the average volume over a user-defined lookback period.
• Dynamic Volume Break: Highlights bars where the volume exceeds a threshold, dynamically calculated as a multiple of the average volume (default is 10x the average volume).
• Price Color on Volume Spike: When a volume spike occurs, bars are colored green if the price closes higher than the previous bar, and red if the price closes lower. This feature helps traders easily identify significant price movements during high-volume periods.
• Customizable Parameters:
• Threshold Multiplier: Adjust the sensitivity of volume spike detection.
• Lookback Period: Define the period over which the average volume is calculated.
• Volume Break Multiplier: Set a multiplier for the average volume to identify extreme volume breaks.
This indicator is suitable for traders who want to quickly spot critical market events driven by significant increases in volume. It helps to visualize both the volume activity and the corresponding price movement, providing an additional layer of market insight.
How to Use:
1. Green Bars: When the volume spike condition is met and the price closes higher than the previous bar, the bar is colored green.
2. Red Bars: When the volume spike condition is met and the price closes lower than the previous bar, the bar is colored red.
3. Blue Bars: Indicates a significant volume break, where the current volume exceeds a specified multiple of the average volume (default: 10x).
Ideal for intraday and swing traders who rely on volume and price action for market entries and exits. This indicator works well across different asset classes, including stocks, forex, and cryptocurrencies.
You can adjust the input parameters to fit your specific trading strategy and timeframe.
Disclaimer: This indicator is a tool to help with market analysis and should not be considered financial advice. Always perform your own due diligence before making any trading decisions.
This description outlines the key functionality and how the indicator can benefit traders on TradingView.
开源脚本
秉承TradingView的精神,该脚本的作者将其开源,以便交易者可以查看和验证其功能。向作者致敬!您可以免费使用该脚本,但请记住,重新发布代码须遵守我们的网站规则。
免责声明
这些信息和出版物并非旨在提供,也不构成TradingView提供或认可的任何形式的财务、投资、交易或其他类型的建议或推荐。请阅读使用条款了解更多信息。
开源脚本
秉承TradingView的精神,该脚本的作者将其开源,以便交易者可以查看和验证其功能。向作者致敬!您可以免费使用该脚本,但请记住,重新发布代码须遵守我们的网站规则。
免责声明
这些信息和出版物并非旨在提供,也不构成TradingView提供或认可的任何形式的财务、投资、交易或其他类型的建议或推荐。请阅读使用条款了解更多信息。