OPEN-SOURCE SCRIPT
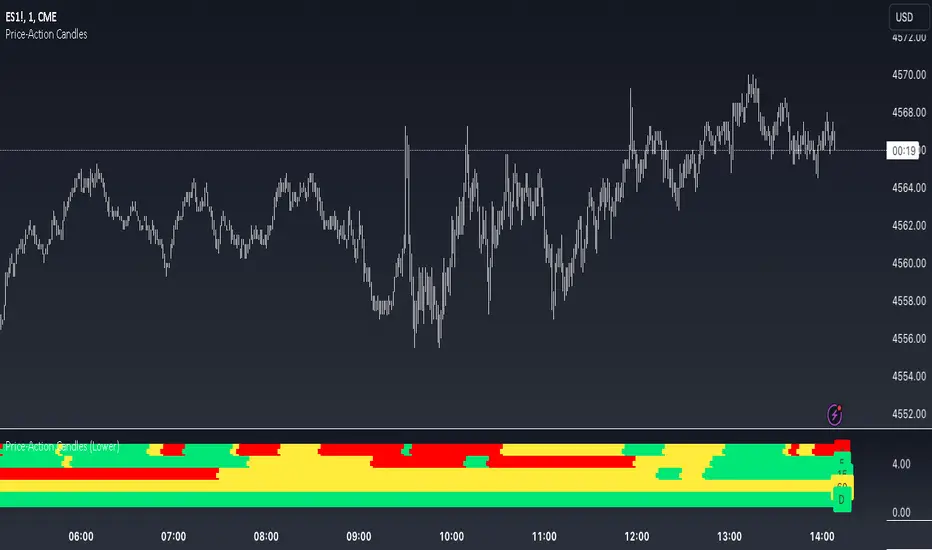
Price-Action Candles (Lower)
What is a swing high or swing low?
Swing highs and lows are price extremes. For example say we set our swing length to 5. A candle that is a swing high with a swing length of 5 will have 5 bars to the left that are lower and 5 bars to the right that are lower. A candle that is a swing low with a swing length of 5 will have 5 bars to the left that are higher and 5 bars to the right that are higher.
How is the trend coloring calculated?
The trend coloring is calculated the exact same way as our trend candles study...https://www.tradingview.com/script/V9T81uWb-Price-Action-Candles/by storing and comparing historical swing lows and swing highs.
The pinescript code goes as follows:
Pine Script®
What does that gibberish mean?
-Trend can be GREEN IF
- We have a higher high (current swing high is greater than the previous swing high) and the high is greater than the previous swing high
- OR The current close is greater than the current swing high
-Trend can be RED IF
- We have a lower low (current swing low is less than the previous swing low) and the low is less than the previous swing low
- OR The current close is less than the current swing low
-Trend can be YELLOW IF
- We have a new swing high and the new swing high is less than the previous swing high
- OR We have a new swing low and the new swing low is greater than the previous swing low
If none of the conditions above are true then we continue with whatever color the previous bar was.
What is repainting?
Repainting is "script behavior causing historical vs realtime calculations or plots to behave differently." That definition comes directly from Tradingview. If you want to read the full explanation you can visit it here https://www.tradingview.com/pine-script-docs/en/v5/concepts/Repainting.html#future-leak-with-request-security . The price-action candles use swing highs and swing lows which need bars to the left (past) and bars to the right ("future") in order to confirm the swing level. Because of the need to wait for confirmation for swing levels the plot style can be repainting. The Price-Action Candles (Lower) indicator, or this indicator, has no repainting anywhere. We opt to not shift back the candle coloring which causes the repainting, but it is relevant to discuss since this indicator's sibling (Price-Action Candles) can have repainting labels.
Repaint
Here the labels are shifted back the price-action length. Repainting is not present in the Price-Candles (Lower) study, but can be found in this indicator's sibling (Price-Action Candles).

Non-Repaint
Here the labels are not shifted back or "repainted". Repainting is not present in the Price-Candles (Lower) study, but can be found in this indicator's sibling (Price-Action Candles).

Multi-timeframe Analysis
The users can view multi-timeframe historical price action trend via this lower study. Each timeframe is plotted as its own on the lower pane and you can determine what timeframe it is by the label next to the plot.
More examples


Pair the Price-Action Candles (Lower) indicator with our main price indicator that colors candles based on trend and can show price action labels.
https://www.tradingview.com/script/V9T81uWb-Price-Action-Candles/
Swing highs and lows are price extremes. For example say we set our swing length to 5. A candle that is a swing high with a swing length of 5 will have 5 bars to the left that are lower and 5 bars to the right that are lower. A candle that is a swing low with a swing length of 5 will have 5 bars to the left that are higher and 5 bars to the right that are higher.
How is the trend coloring calculated?
The trend coloring is calculated the exact same way as our trend candles study...https://www.tradingview.com/script/V9T81uWb-Price-Action-Candles/by storing and comparing historical swing lows and swing highs.
The pinescript code goes as follows:
The pinescript code goes as follows:
var int trend = na
trend := ((hh and high >= psh) or close > csh) ? 1 : ((ll and low <= psl) or close < csl) ? -1 : lh or hl ? 0 : trend[1]
What does that gibberish mean?
-Trend can be GREEN IF
- We have a higher high (current swing high is greater than the previous swing high) and the high is greater than the previous swing high
- OR The current close is greater than the current swing high
-Trend can be RED IF
- We have a lower low (current swing low is less than the previous swing low) and the low is less than the previous swing low
- OR The current close is less than the current swing low
-Trend can be YELLOW IF
- We have a new swing high and the new swing high is less than the previous swing high
- OR We have a new swing low and the new swing low is greater than the previous swing low
If none of the conditions above are true then we continue with whatever color the previous bar was.
What is repainting?
Repainting is "script behavior causing historical vs realtime calculations or plots to behave differently." That definition comes directly from Tradingview. If you want to read the full explanation you can visit it here https://www.tradingview.com/pine-script-docs/en/v5/concepts/Repainting.html#future-leak-with-request-security . The price-action candles use swing highs and swing lows which need bars to the left (past) and bars to the right ("future") in order to confirm the swing level. Because of the need to wait for confirmation for swing levels the plot style can be repainting. The Price-Action Candles (Lower) indicator, or this indicator, has no repainting anywhere. We opt to not shift back the candle coloring which causes the repainting, but it is relevant to discuss since this indicator's sibling (Price-Action Candles) can have repainting labels.
Repaint
Here the labels are shifted back the price-action length. Repainting is not present in the Price-Candles (Lower) study, but can be found in this indicator's sibling (Price-Action Candles).
Non-Repaint
Here the labels are not shifted back or "repainted". Repainting is not present in the Price-Candles (Lower) study, but can be found in this indicator's sibling (Price-Action Candles).
Multi-timeframe Analysis
The users can view multi-timeframe historical price action trend via this lower study. Each timeframe is plotted as its own on the lower pane and you can determine what timeframe it is by the label next to the plot.
More examples
Pair the Price-Action Candles (Lower) indicator with our main price indicator that colors candles based on trend and can show price action labels.
https://www.tradingview.com/script/V9T81uWb-Price-Action-Candles/
开源脚本
秉承TradingView的精神,该脚本的作者将其开源,以便交易者可以查看和验证其功能。向作者致敬!您可以免费使用该脚本,但请记住,重新发布代码须遵守我们的网站规则。
免责声明
这些信息和出版物并非旨在提供,也不构成TradingView提供或认可的任何形式的财务、投资、交易或其他类型的建议或推荐。请阅读使用条款了解更多信息。
免责声明
这些信息和出版物并非旨在提供,也不构成TradingView提供或认可的任何形式的财务、投资、交易或其他类型的建议或推荐。请阅读使用条款了解更多信息。