PROTECTED SOURCE SCRIPT
Multi Fixed MA
Multi Fixed MA Indicator
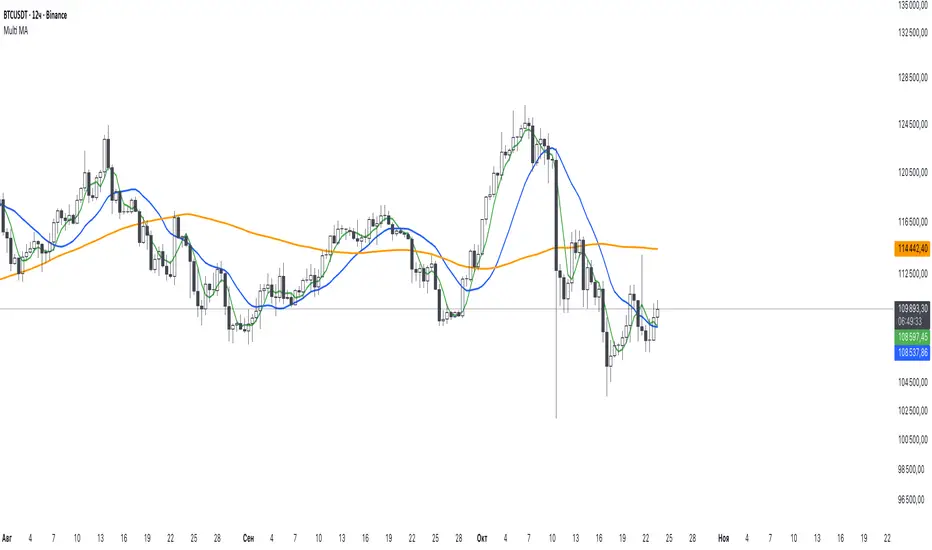
This Pine Script indicator displays up to three customizable Moving Averages (MAs) on the chart, allowing users to analyze price trends across different timeframes. Each MA can be independently configured for type, length, timeframe, and colors for bullish and bearish slopes.
Features:
MA Types: Choose from Simple (SMA), Exponential (EMA), Weighted (WMA), or Linear Regression (Linear) MAs.
Customizable Timeframes: Select from a range of timeframes (1min to 1M) for each MA.
Show/Hide MAs: Enable or disable each of the three MAs via checkboxes.
Dynamic Coloring: Each MA changes color based on its slope (bullish or bearish), with user-defined bull and bear colors.
Flexible Lengths: Set individual lengths for each MA.
Usage:
Configure the MA type, length, and timeframe for each of the three MAs.
Toggle visibility for each MA using the "Show" checkboxes.
Customize bull and bear colors for each MA to visually distinguish trends.
The indicator plots MAs on the chart, with colors reflecting whether the current MA value is higher (bullish) or lower (bearish) than the previous value, maintaining the prior color when equal.
Ideal for traders analyzing trends across multiple timeframes with tailored visual cues.
受保护脚本
此脚本以闭源形式发布。 但是,您可以自由使用,没有任何限制 — 了解更多信息这里。
免责声明
这些信息和出版物并非旨在提供,也不构成TradingView提供或认可的任何形式的财务、投资、交易或其他类型的建议或推荐。请阅读使用条款了解更多信息。
受保护脚本
此脚本以闭源形式发布。 但是,您可以自由使用,没有任何限制 — 了解更多信息这里。
免责声明
这些信息和出版物并非旨在提供,也不构成TradingView提供或认可的任何形式的财务、投资、交易或其他类型的建议或推荐。请阅读使用条款了解更多信息。