OPEN-SOURCE SCRIPT
Multi-SMA Dashboard (10 SMAs)
Description:
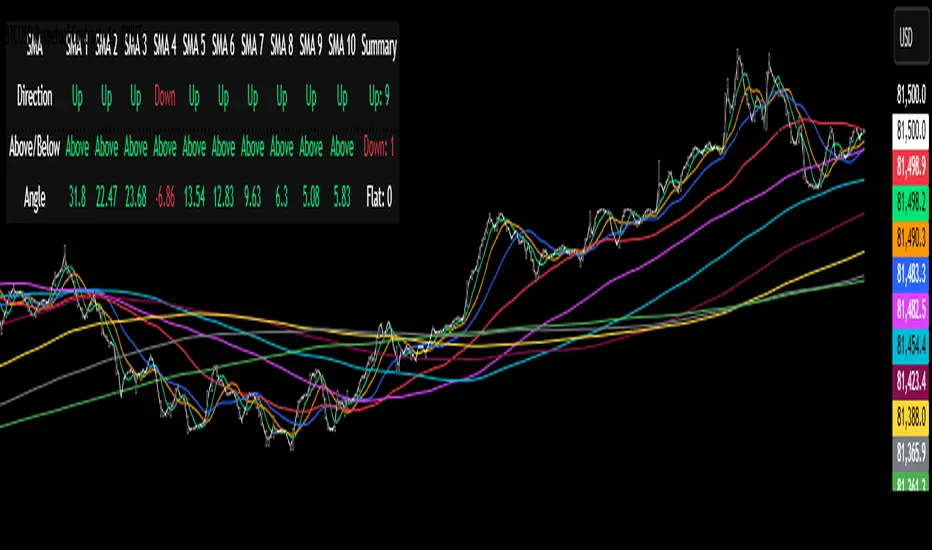
This script, "Multi-SMA Dashboard (10 SMAs)," creates a dashboard on a TradingView chart to analyze ten Simple Moving Averages (SMAs) of varying lengths. It overlays the chart and displays a table with each SMA’s direction, price position relative to the SMA, and angle of movement, providing a comprehensive trend overview.
How It Works:
1. **Inputs**: Users define lengths for 10 SMAs (default: 5, 10, 20, 50, 100, 150, 200, 250, 300, 350), select a price source (default: close), and customize table appearance and options like angle units (degrees/radians) and debug plots.
2. **SMA Calculation**: Computes 10 SMAs using the `ta.sma()` function with user-specified lengths and price source.
3. **Direction Determination**: The `sma_direction()` function checks each SMA’s trend:
- "Up" if current SMA > previous SMA.
- "Down" if current SMA < previous SMA.
- "Flat" if equal (no strength distinction).
4. **Price Position**: Compares the price source to each SMA, labeling it "Above" or "Below."
5. **Angle Calculation**: Tracks the most recent direction change point for each SMA and calculates its angle (atan of price change over time) in degrees or radians, based on the `showInRadians` toggle.
6. **Table Display**: A 12-column table shows:
- Columns 1-10: SMA name, direction (Up/Down/Flat), Above/Below status, and angle.
- Column 11: Summary of Up, Down, and Flat counts.
- Colors reflect direction (lime for Up/Above, red for Down/Below, white for Flat).
7. **Debug Option**: Optionally plots all SMAs and price for visual verification when `debug_plots_toggle` is enabled.
Indicators Used:
- Simple Moving Averages (SMAs): 10 user-configurable SMAs ranging from short-term (e.g., 5) to long-term (e.g., 350) periods.
The script runs continuously, updating the table on each bar, and overlays the chart to assist traders in assessing multi-timeframe trend direction and momentum without cluttering the view unless debug mode is active.
开源脚本
秉承TradingView的精神,该脚本的作者将其开源,以便交易者可以查看和验证其功能。向作者致敬!您可以免费使用该脚本,但请记住,重新发布代码须遵守我们的网站规则。
免责声明
这些信息和出版物并非旨在提供,也不构成TradingView提供或认可的任何形式的财务、投资、交易或其他类型的建议或推荐。请阅读使用条款了解更多信息。
免责声明
这些信息和出版物并非旨在提供,也不构成TradingView提供或认可的任何形式的财务、投资、交易或其他类型的建议或推荐。请阅读使用条款了解更多信息。