OPEN-SOURCE SCRIPT
已更新 ZigZag Multi Time Frame with Fibonacci Retracement
Hello Traders,
This is ZigZag Multi Time Frame with Fibonacci Retracement script. It calculates the ZigZag using Higher Time Frame, draw Fibonacci Retracement lines and put labels accordingly. I already published Zigzag with Fibonacci Levels script but this one is Multi Time Frame and I didn't want to change/update it.
You can set ZigZag Period and Resolution as you wish. Zigzag is calculated using higher time frames (ex: 1day) so you better choose small numbers as Zigzag Period, such 2, 3 etc. you should choose higher time frame wisely, meaning that you should not set 1Day while chart resolution is 1min ;)
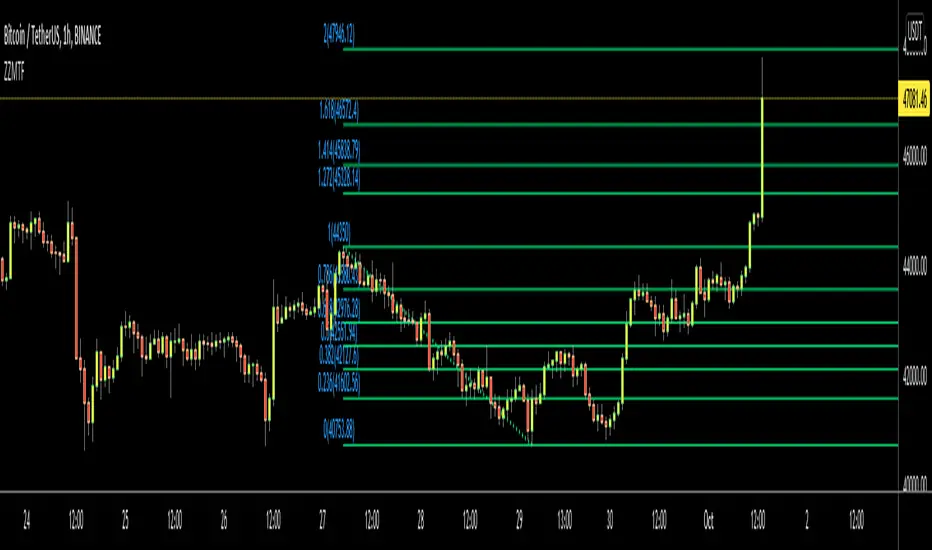
It draws Fibonacci levels between 0%-100% and If the price goes higher/lower than 100% level than the script draws Fibonacci Levels accordingly. This means it draws Fibonacci levels until this levels get higher/lower than the price.
"Show Zig Zag" is not enabled by default, you can enable it if you want to see ZigZag as well.
You have options to set Text Color, Line Color, Zigzag Up Color and Zigzag Down Color.
You can set the location of the Fibonnaci Levels -> Left or Right
You also have option to enable/disable following Fibonnaci Levels:
---> 0.236
---> 0.382
---> 0.500
---> 0.618
---> 0.786
I added "Colorful Fibonacci Levels" for fun. if you enable it then Fibonacci line colors will be different randomly on each move, see it for yourself :)
Some Screenshots:
if you enable "Show Zigzag Option":

how the script adjust levels automatically:

if you set Label Location as "Right":

if you enable "Colorful Fibonacci Levels" then Line colors will be changed on each move randomly ;)

Enjoy!
This is ZigZag Multi Time Frame with Fibonacci Retracement script. It calculates the ZigZag using Higher Time Frame, draw Fibonacci Retracement lines and put labels accordingly. I already published Zigzag with Fibonacci Levels script but this one is Multi Time Frame and I didn't want to change/update it.
You can set ZigZag Period and Resolution as you wish. Zigzag is calculated using higher time frames (ex: 1day) so you better choose small numbers as Zigzag Period, such 2, 3 etc. you should choose higher time frame wisely, meaning that you should not set 1Day while chart resolution is 1min ;)
It draws Fibonacci levels between 0%-100% and If the price goes higher/lower than 100% level than the script draws Fibonacci Levels accordingly. This means it draws Fibonacci levels until this levels get higher/lower than the price.
"Show Zig Zag" is not enabled by default, you can enable it if you want to see ZigZag as well.
You have options to set Text Color, Line Color, Zigzag Up Color and Zigzag Down Color.
You can set the location of the Fibonnaci Levels -> Left or Right
You also have option to enable/disable following Fibonnaci Levels:
---> 0.236
---> 0.382
---> 0.500
---> 0.618
---> 0.786
I added "Colorful Fibonacci Levels" for fun. if you enable it then Fibonacci line colors will be different randomly on each move, see it for yourself :)
Some Screenshots:
if you enable "Show Zigzag Option":
how the script adjust levels automatically:
if you set Label Location as "Right":
if you enable "Colorful Fibonacci Levels" then Line colors will be changed on each move randomly ;)
Enjoy!
版本注释
Show zigzag part improvedround_to_mintick() function used
bar_index is used for labels (instead of time)
版本注释
updated版本注释
options organized开源脚本
秉承TradingView的精神,该脚本的作者将其开源,以便交易者可以查看和验证其功能。向作者致敬!您可以免费使用该脚本,但请记住,重新发布代码须遵守我们的网站规则。
Our Free Official Telegram Channel: t.me/LonesomeTheBlue_Official
免责声明
这些信息和出版物并非旨在提供,也不构成TradingView提供或认可的任何形式的财务、投资、交易或其他类型的建议或推荐。请阅读使用条款了解更多信息。
开源脚本
秉承TradingView的精神,该脚本的作者将其开源,以便交易者可以查看和验证其功能。向作者致敬!您可以免费使用该脚本,但请记住,重新发布代码须遵守我们的网站规则。
Our Free Official Telegram Channel: t.me/LonesomeTheBlue_Official
免责声明
这些信息和出版物并非旨在提供,也不构成TradingView提供或认可的任何形式的财务、投资、交易或其他类型的建议或推荐。请阅读使用条款了解更多信息。