PROTECTED SOURCE SCRIPT
已更新 Medium-Term Valuation | MiesOnCharts
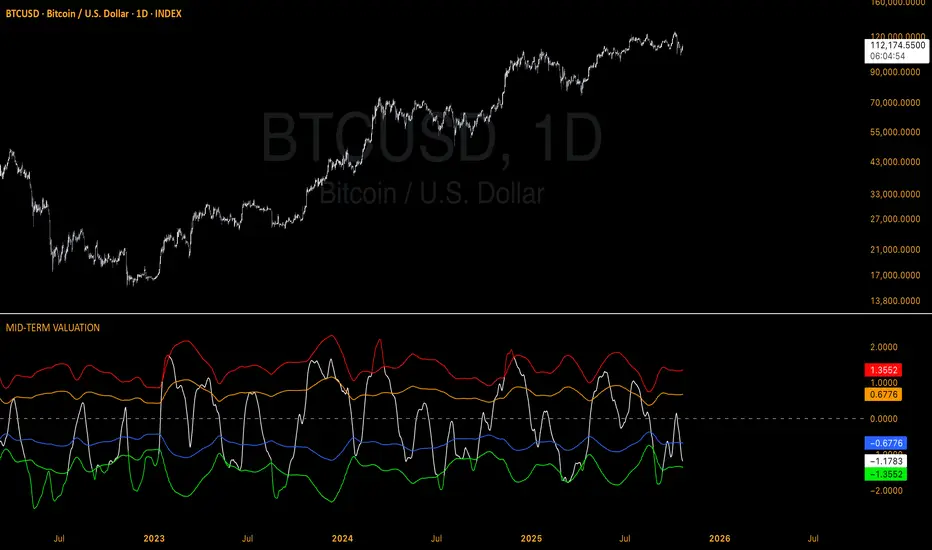
This medium-term valuation indicator integrates multiple valuation metrics to assist investors in identifying oversold and overbought market conditions with greater precision.
How to Interpret:
The indicator employs adaptive standard deviation bands to define extreme market zones. The red band signals a strongly overbought condition, while the green band indicates a significantly oversold condition.
How to Apply:
Investors can leverage these extreme levels as strategic points for taking profits or implementing dollar-cost averaging (DCA) strategies, optimizing entry and exit decisions in the market.
Disclaimer: NOT Financial advice. Past performance is not indicative of future results. No trading strategy can guarantee success in financial markets.
版本注释
/受保护脚本
此脚本以闭源形式发布。 但是,您可以自由使用它,没有任何限制 — 在此处了解更多信息。
免责声明
这些信息和出版物并不意味着也不构成TradingView提供或认可的金融、投资、交易或其它类型的建议或背书。请在使用条款阅读更多信息。
受保护脚本
此脚本以闭源形式发布。 但是,您可以自由使用它,没有任何限制 — 在此处了解更多信息。
免责声明
这些信息和出版物并不意味着也不构成TradingView提供或认可的金融、投资、交易或其它类型的建议或背书。请在使用条款阅读更多信息。