OPEN-SOURCE SCRIPT
Earnings Surprise Indicator (Post-Earnings Announcement Drift)
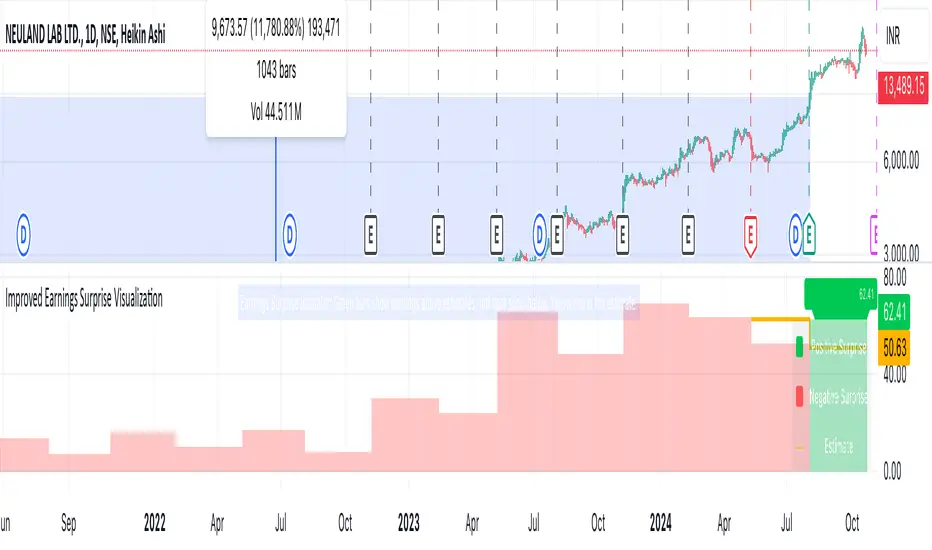
What It Does:
- Displays a company's actual earnings vs. analysts' estimates over time
- Shows "earnings surprises" - when actual results beat or miss expectations
- Helps identify trends in a company's financial performance
How It Works:
- Green bars: Positive surprise (earnings beat estimates)
- Red bars: Negative surprise (earnings missed estimates)
- Yellow line: Analysts' earnings estimates
Correlation with Post Earnings Announcement Drift (PEAD): PEAD is the tendency for a stock's price to drift in the direction of an earnings surprise for several weeks or months after the announcement.
Why It Matters:
- Positive surprises often lead to upward price drift
- Negative surprises often lead to downward price drift
- This drift can create trading opportunities
How to Use It:
1. Spot Trends:
- Consistent beats may indicate strong company performance
- Consistent misses may signal underlying issues
2. Gauge Market Expectations:
- Large surprises may lead to significant price movements
3. Timing Decisions:
- Consider long positions after positive surprises
- Consider short positions or exits after negative surprises
4. Risk Management:
- Be cautious of reversal if the drift seems excessive
- Use in conjunction with other technical and fundamental analysis
Key Takeaways:
- Earnings surprises can be fundamental-leading indicators of future stock performance, especially when correlated with analyst projections
- PEAD suggests that markets often underreact to earnings news initially
- This indicator helps visualize the magnitude and direction of surprises
- It can be a valuable tool for timing entry and exit points in trades
开源脚本
秉承TradingView的精神,该脚本的作者将其开源,以便交易者可以查看和验证其功能。向作者致敬!您可以免费使用该脚本,但请记住,重新发布代码须遵守我们的网站规则。
免责声明
这些信息和出版物并非旨在提供,也不构成TradingView提供或认可的任何形式的财务、投资、交易或其他类型的建议或推荐。请阅读使用条款了解更多信息。
开源脚本
秉承TradingView的精神,该脚本的作者将其开源,以便交易者可以查看和验证其功能。向作者致敬!您可以免费使用该脚本,但请记住,重新发布代码须遵守我们的网站规则。
免责声明
这些信息和出版物并非旨在提供,也不构成TradingView提供或认可的任何形式的财务、投资、交易或其他类型的建议或推荐。请阅读使用条款了解更多信息。