OPEN-SOURCE SCRIPT
Volume Surge Webhook Alert
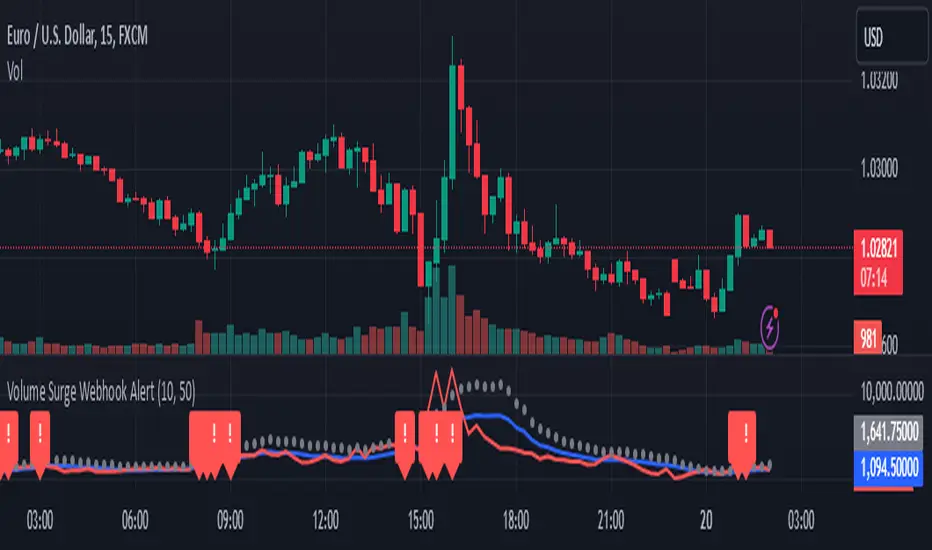
This TradingView indicator, named "Volume Surge Webhook Alert," is designed to find significant increases in trading volume and send out alerts with key information. It works by looking back at the volume over a certain number of past candlesticks, which you can set using the "Lookback Period" input. The indicator calculates the average volume during this period. Then, it sets a threshold for what counts as a "volume surge." This threshold is a percentage increase over the average volume, and you can adjust this percentage using the "Volume Surge Threshold (%)" input.
When the current candlestick's volume is higher than this threshold, the indicator considers it a volume surge. To help you see this visually, the indicator plots three lines on a separate chart: the average volume (in blue), the current volume (in red), and the threshold volume (in gray circles).
If a volume surge happens, the indicator creates a webhook alert. This alert sends a message in a structured format (like a digital envelope) that contains the following information: the symbol of the stock or cryptocurrency, the timeframe of the chart you're looking at, the current volume, the average volume, the threshold volume, and a simple message saying a volume surge was detected. This alert is sent only once when the candlestick closes with a volume surge.
Additionally, when a volume surge is detected, a small red exclamation mark "!" will appear above that candlestick on the main price chart.
Essentially, this indicator helps traders spot times when trading volume is unusually high, which can sometimes be a sign of important price movements. You can customize how sensitive the indicator is by changing the "Lookback Period" and the "Volume Surge Threshold (%)". The webhook alerts allow you to be notified automatically when these surges occur, so you don't have to constantly watch the charts.
开源脚本
秉承TradingView的精神,该脚本的作者将其开源,以便交易者可以查看和验证其功能。向作者致敬!您可以免费使用该脚本,但请记住,重新发布代码须遵守我们的网站规则。
免责声明
这些信息和出版物并非旨在提供,也不构成TradingView提供或认可的任何形式的财务、投资、交易或其他类型的建议或推荐。请阅读使用条款了解更多信息。
开源脚本
秉承TradingView的精神,该脚本的作者将其开源,以便交易者可以查看和验证其功能。向作者致敬!您可以免费使用该脚本,但请记住,重新发布代码须遵守我们的网站规则。
免责声明
这些信息和出版物并非旨在提供,也不构成TradingView提供或认可的任何形式的财务、投资、交易或其他类型的建议或推荐。请阅读使用条款了解更多信息。