OPEN-SOURCE SCRIPT
Volume DI Diff + ADX Coloreado por AO
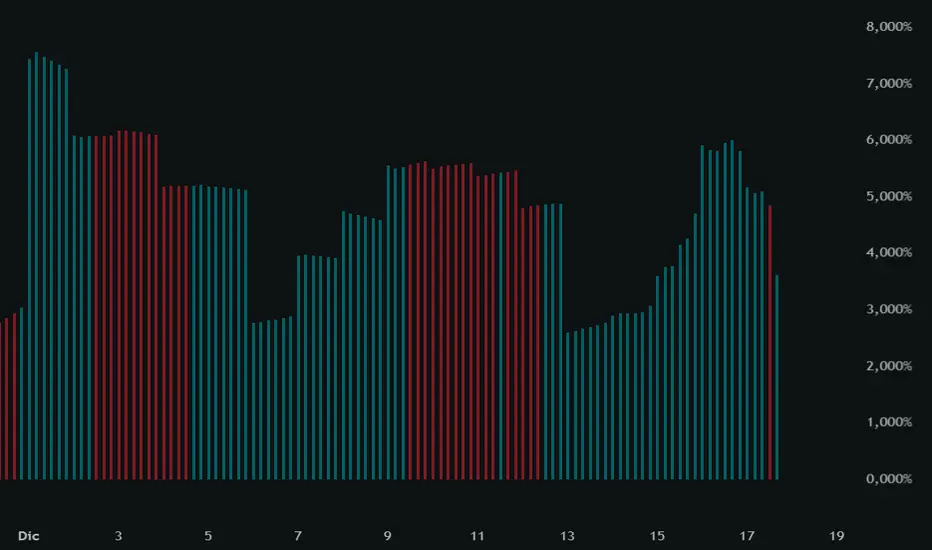
InterpretationIf +DI > -DI (positive DI+ - DI- difference) → Upward trend pressure (bullish signal).
If -DI > +DI (negative DI+ - DI- difference) → Downward trend pressure (bearish signal).
Crossovers between +DI and -DI generate buy/sell signals, often filtered by ADX for reliability.
This setup is widely used in technical analysis to identify trending markets and avoid whipsaws in ranging conditions. It's part of the broader Average Directional Movement System (ADX/DMI).
Key ComponentsADX line: Measures overall trend strength (non-directional).
+DI line: Strength of upward movement.
-DI line: Strength of downward movement.
Trend direction is determined by which DI line is dominant:+DI > -DI: Bullish trend (upward pressure).
-DI > +DI: Bearish trend (downward pressure).
Crossovers between +DI and -DI can signal potential trend changes, but they are most reliable when ADX confirms sufficient strength.ADX Trend Strength Levels (Common Interpretations)ADX Value
Trend Strength
Recommendation
0–20
Weak or no trend (ranging/sideways market)
Avoid trend-following strategies; consider range-bound or oscillator-based trades.
20–25
Emerging or moderate trend (gray zone)
Monitor for confirmation; potential start of trend.
25–50
Strong trend
Ideal for trend-following strategies (e.g., moving averages, breakouts).
50–75
Very strong trend
High momentum; good for riding trends, but watch for exhaustion.
75–100
Extremely strong trend (rare)
Often overextended; risk of reversal or correction.
Rising ADX: Trend is strengthening.
Falling ADX: Trend is weakening (even if still high).
开源脚本
秉承TradingView的精神,该脚本的作者将其开源,以便交易者可以查看和验证其功能。向作者致敬!您可以免费使用该脚本,但请记住,重新发布代码须遵守我们的网站规则。
免责声明
这些信息和出版物并非旨在提供,也不构成TradingView提供或认可的任何形式的财务、投资、交易或其他类型的建议或推荐。请阅读使用条款了解更多信息。
开源脚本
秉承TradingView的精神,该脚本的作者将其开源,以便交易者可以查看和验证其功能。向作者致敬!您可以免费使用该脚本,但请记住,重新发布代码须遵守我们的网站规则。
免责声明
这些信息和出版物并非旨在提供,也不构成TradingView提供或认可的任何形式的财务、投资、交易或其他类型的建议或推荐。请阅读使用条款了解更多信息。