OPEN-SOURCE SCRIPT
Wyckoff Method Indicator
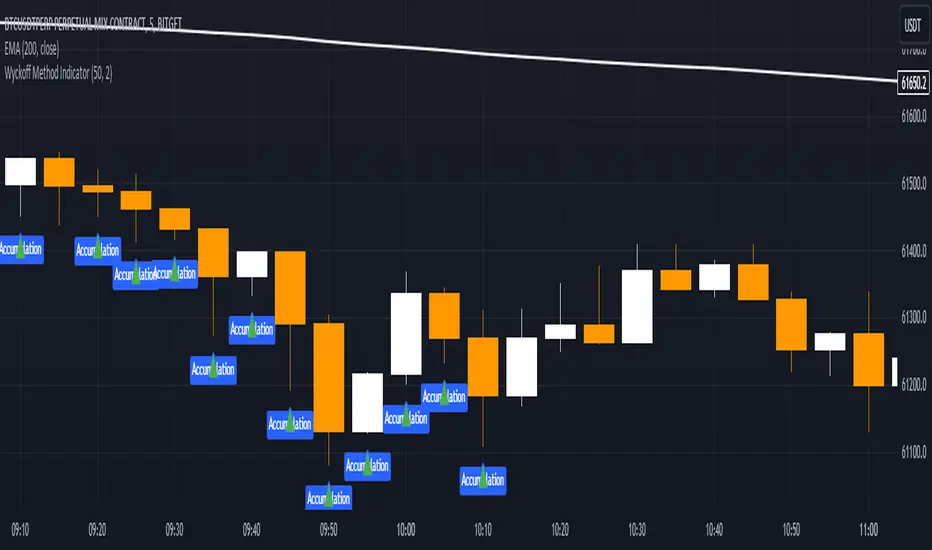
The Wyckoff Method Market Cycle Indicator is a powerful tool designed to help traders identify the current market phase based on the principles of the Wyckoff Method. This indicator analyzes price action and volume patterns to determine whether the market is in an accumulation, markup, distribution, or markdown phase.
The Wyckoff Method, developed by Richard D. Wyckoff, is a time-tested approach to understanding market dynamics and identifying potential trading opportunities. By studying the interaction between price and volume, the Wyckoff Method aims to provide insight into the actions of market participants and the potential direction of the market.
This indicator automatically detects the key market phases as defined by the Wyckoff Method:
Accumulation: This phase occurs when large institutional investors are quietly accumulating positions, often leading to a period of consolidation with low volatility and decreasing volume.
Markup: Following the accumulation phase, the markup phase is characterized by a breakout above the accumulation range, accompanied by increasing volume. This indicates a potential bullish trend.
Distribution: After a significant price advance, the distribution phase emerges. It is marked by high volatility and increasing volume as large investors begin to distribute their holdings to the public.
Markdown: The markdown phase follows the distribution phase and is characterized by a breakdown below the distribution range, accompanied by increasing volume. This suggests a potential bearish trend.
The indicator plots the detected market phases on the chart using the following signals:
Green triangle pointing upwards: Accumulation phase
Blue triangle pointing downwards: Markup phase
Red triangle pointing downwards: Distribution phase
Orange triangle pointing upwards: Markdown phase
By utilizing this indicator, traders can gain valuable insights into the underlying market structure and make more informed trading decisions. However, it is important to note that the Wyckoff Method Market Cycle Indicator should be used in conjunction with other technical analysis tools and risk management strategies.
The indicator provides two input parameters:
Lookback Period: The number of bars used to calculate the volatility and determine the market phases. The default value is 50.
Volume Condition Multiple: The multiple used to compare the current volume with the volume of the lookback period. The default value is 2.
Traders can adjust these parameters to suit their specific trading style and the characteristics of the asset being analyzed.
Please note that this indicator is intended for educational and informational purposes only. It does not constitute financial advice. Always conduct your own analysis and exercise proper risk management when trading.
Happy trading!
开源脚本
秉承TradingView的精神,该脚本的作者将其开源,以便交易者可以查看和验证其功能。向作者致敬!您可以免费使用该脚本,但请记住,重新发布代码须遵守我们的网站规则。
免责声明
这些信息和出版物并非旨在提供,也不构成TradingView提供或认可的任何形式的财务、投资、交易或其他类型的建议或推荐。请阅读使用条款了解更多信息。
开源脚本
秉承TradingView的精神,该脚本的作者将其开源,以便交易者可以查看和验证其功能。向作者致敬!您可以免费使用该脚本,但请记住,重新发布代码须遵守我们的网站规则。
免责声明
这些信息和出版物并非旨在提供,也不构成TradingView提供或认可的任何形式的财务、投资、交易或其他类型的建议或推荐。请阅读使用条款了解更多信息。