OPEN-SOURCE SCRIPT
ysantur trendfollower
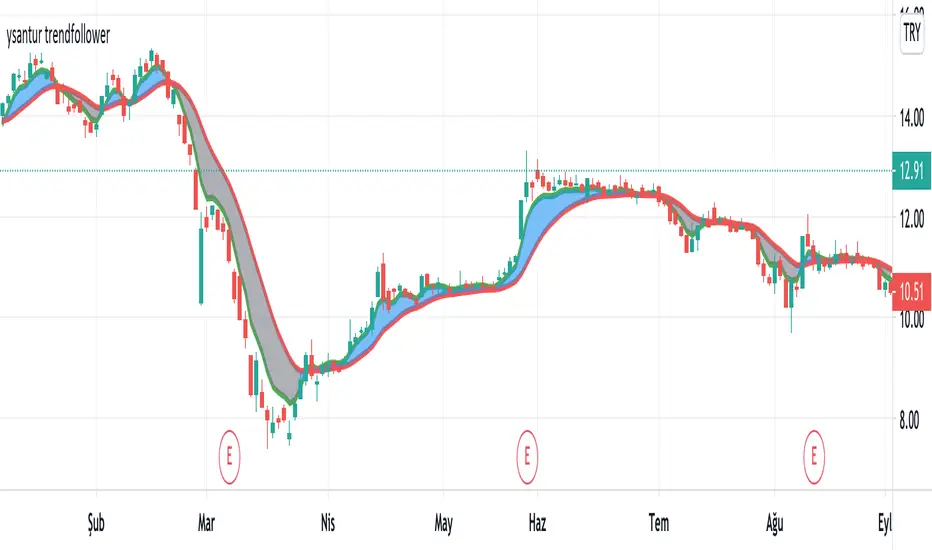
It is an indicator that aims to stay in the trend by generating a buy or sell signal according to the intersection of two moving averages. The first trend line is a moving average whose weights are calculated based on fibonacci numbers or golden ratio. The second trend line is achieved by smoothing the first. Thus, two trend lines, one faster and one slower, are obtained.
How does it work
- When the fast line cross over the slow line, it generates a buy signal. On the contrary, a sell signal occurs when the fast trend line cross under the slower trend
- The area between the two trend lines is colored for easier understanding. Blue cloud shows "Bullish", gray cloud shows "Bearish"
- If prices are above the blue cloud, it indicates a strong Bullish trend.
- When prices go under the gray cloud, a strong bearish trend is observed.
- Prices being in the cloud should be treated as a "Hold" signal. In this case, the fast trend will act as resistance and slow trend act as a support. Position should be changed according to the situation.
- While there is a blue cloud, that is, in the bull trend, the two trend lines moving too far from each other may indicate a possible correction / reversal.
- While there is a gray cloud, that is, in the bear trend, the divergence of two trend lines from each other may indicate a possible correction / reversal.
- While in the bearish trend, prices move far from the cloud and re-enter into the cloud in near time. When these levels are monitored carefully, a return from a possible bear trend can be caught early.
As with every indicator, it can produce false signals in the horizontal market, so it should not be used alone. I continue to improve on it to put it in less positions due to commission and slip, not to generate false signals in the horizontal market. Now I can say that it produces good results in daily periods, not bad in hourly and 4 hours periods. Backtest is required for shorter periods. Please feel free to comment and write for my improvement.
开源脚本
秉承TradingView的精神,该脚本的作者将其开源,以便交易者可以查看和验证其功能。向作者致敬!您可以免费使用该脚本,但请记住,重新发布代码须遵守我们的网站规则。
免责声明
这些信息和出版物并非旨在提供,也不构成TradingView提供或认可的任何形式的财务、投资、交易或其他类型的建议或推荐。请阅读使用条款了解更多信息。
免责声明
这些信息和出版物并非旨在提供,也不构成TradingView提供或认可的任何形式的财务、投资、交易或其他类型的建议或推荐。请阅读使用条款了解更多信息。