OPEN-SOURCE SCRIPT
已更新 Trend Probabilty Indicator - MultiTimeFrame (MTF TPI)
Thank you @lukas.nie and DerozBeats for your help with stacking the library!
The Ultimate TPI
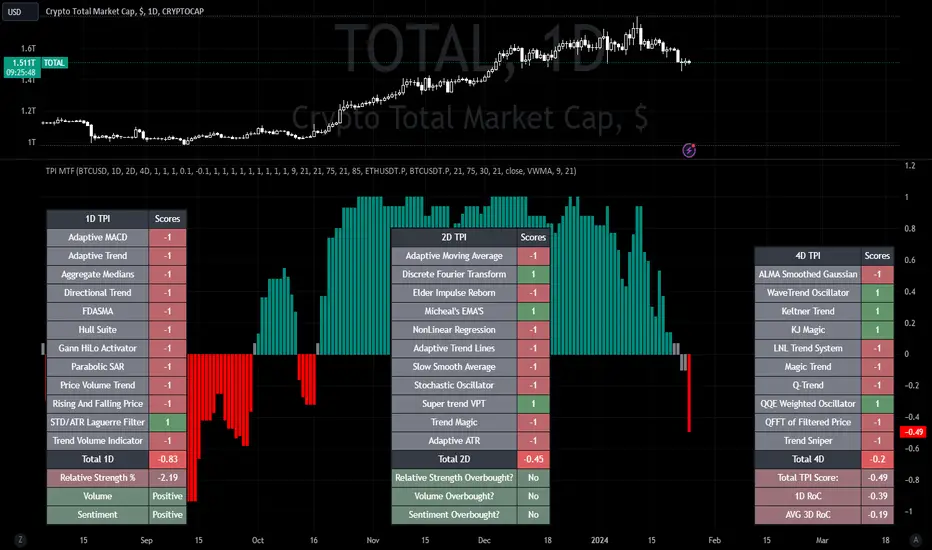
the FINAL TPI SCORE is plotted on the chart (Between -1 and 1). (Small number on the right hand side).
Shows the aggregated score of 3 different timeframes plus the total score of all 3 in the Total TPI Score Table Cell.
There has been a lot of mods to this, and the description is roughly accurate. Check it out and learn how it works. If you have any questions hit me up.
LFG!!!
The Ultimate TPI
the FINAL TPI SCORE is plotted on the chart (Between -1 and 1). (Small number on the right hand side).
Shows the aggregated score of 3 different timeframes plus the total score of all 3 in the Total TPI Score Table Cell.
There has been a lot of mods to this, and the description is roughly accurate. Check it out and learn how it works. If you have any questions hit me up.
LFG!!!
版本注释
Updated some plotting and calculation issues. Next up: Calibrating time coherency for optimal results.版本注释
Updates to allow the indicator to choose between the chart ticker or the ticker in the user settings. Timeframe is always FIXED at 1D, 2D, 4D for each respective table.
版本注释
.版本注释
Code Cleanup...thank you Back版本注释
Updated signals. Less quick, more coherent.版本注释
..版本注释
.版本注释
...版本注释
Updated to allow for customizable Timeframes. 版本注释
If an Indicator returns a NaN instead of a value, it produces a score of 0. 版本注释
Added a RoC plot for previous day's candle vs current, with a user setting to remove the plot if wanted.版本注释
Updated to the TITS!版本注释
.版本注释
..版本注释
Inspiration from Koro and Investingmaster's "Ultimate System"TPI FINAL PLOT includes the total TPI AVG, averaged alongside salxx's EMA Bands and Back's VWMA.
Final plot is now a histogram of RoC. the RoC tables are calculated from final plot and not total TPI score.
Includes the option to add correlation to the final TPI score. Correlation has 3 timeframes and 5 tickers. Fuck around and find out.
FINAL TPI Score is weighted like this: TPIx2. EMAx1. VWMAx1. Correlationx1 (if turned on).
This TPI also includes an RSI for Relative Strength, Volume and Sentiment. It has a sentiment zone oscillator built in for a general sentiment reading. A Volume Trend Indicator built in for general volume reading. The 9 and 21 day EMA bands are calculated as the distance between each other compared to the overall asset price. This is plotted in the Relative Strength % Table Cell. Use this number to compare against other assets to determine relative strength. The higher the number, the higher the relative strength.
版本注释
Now you can choose what factors to include into the final score.You can also set your own weightings for each factor.
版本注释
Updated Library.版本注释
.版本注释
.版本注释
Fixed RoC calculations.版本注释
Fixed some color coded plotting issues版本注释
Updated with the ability to add weightings to each table. Disable or enable any indicators, and add weighting to the oscillators. Removed the EMA, SMA and VWMA indicators from the final TPI value. It is now strictly an MTF TPI with customizable weightings and enablers. Still kept the dashboard that displays Relative Strength, Volume, Sentiment and RoC as a visual aid. 版本注释
Fixed repainting issue.版本注释
.开源脚本
秉承TradingView的精神,该脚本的作者将其开源,以便交易者可以查看和验证其功能。向作者致敬!您可以免费使用该脚本,但请记住,重新发布代码须遵守我们的网站规则。
免责声明
这些信息和出版物并非旨在提供,也不构成TradingView提供或认可的任何形式的财务、投资、交易或其他类型的建议或推荐。请阅读使用条款了解更多信息。
免责声明
这些信息和出版物并非旨在提供,也不构成TradingView提供或认可的任何形式的财务、投资、交易或其他类型的建议或推荐。请阅读使用条款了解更多信息。