OPEN-SOURCE SCRIPT
已更新 Bitcoin Fair Price Calculator [bitcoinfairprice.com]
1. Purpose of the scriptLong-term Bitcoin valuation based on historical time (days since Genesis block)
Fair Price = theoretically “fair” price according to power law.
Bottom Price = lower support (historically ~58% below Fair Price).
Daily display as on the website – without external access.
Buy/sell signals in case of strong overvaluation/undervaluation.
2. Mathematical model (original formula)pinescript
Bottom Price = Fair Price × 0.42
→ Corresponds historically to ~58% below Fair Price.
Days since Genesis block are calculated automatically per bar.
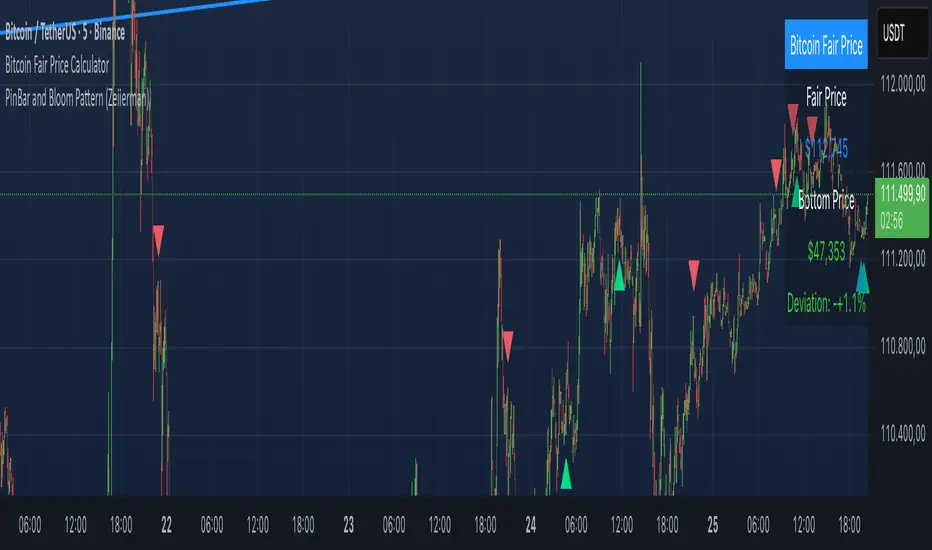
3. What is displayed in the chart?
Fair Price Average power law line (“fair price”) Blue
Bottom Price Lower support (“floor”) Green
Power Law Corridor Filled area between 0.1× and 2.5× Fair Price Light blue (transparent)
Table (top right) Daily values as on the website Black with white text
Label (for >20% deviation) Shows current prices + percentage Red (overvalued) / Green (undervalued)
4. Recommended use Timeframe
Recommendation Weekly / Monthly Best long-term signals
Daily Good balance
Log scale Be sure to activate! (Right-click on Y-axis → “Logarithmic scale”)
9. Strategy tips (based on the model)
Price near bottom --> Buy / accumulate
Price > 2.5× fair price --> Sell part of position / caution
Price between fair & bottom --> Strong buy zone
Deviation < -20% --> HODL signal
Translated with DeepL.com (free version)
Fair Price = theoretically “fair” price according to power law.
Bottom Price = lower support (historically ~58% below Fair Price).
Daily display as on the website – without external access.
Buy/sell signals in case of strong overvaluation/undervaluation.
2. Mathematical model (original formula)pinescript
Bottom Price = Fair Price × 0.42
→ Corresponds historically to ~58% below Fair Price.
Days since Genesis block are calculated automatically per bar.
3. What is displayed in the chart?
Fair Price Average power law line (“fair price”) Blue
Bottom Price Lower support (“floor”) Green
Power Law Corridor Filled area between 0.1× and 2.5× Fair Price Light blue (transparent)
Table (top right) Daily values as on the website Black with white text
Label (for >20% deviation) Shows current prices + percentage Red (overvalued) / Green (undervalued)
4. Recommended use Timeframe
Recommendation Weekly / Monthly Best long-term signals
Daily Good balance
Log scale Be sure to activate! (Right-click on Y-axis → “Logarithmic scale”)
9. Strategy tips (based on the model)
Price near bottom --> Buy / accumulate
Price > 2.5× fair price --> Sell part of position / caution
Price between fair & bottom --> Strong buy zone
Deviation < -20% --> HODL signal
Translated with DeepL.com (free version)
版本注释
1. Purpose of the scriptLong-term Bitcoin valuation based on historical time (days since Genesis block)Fair Price = theoretically “fair” price according to power law.
Bottom Price = lower support (historically ~58% below Fair Price).
Daily display as on the website – without external access.
Buy/sell signals in case of strong overvaluation/undervaluation.
2. Mathematical model (original formula)pinescript
Bottom Price = Fair Price × 0.42
→ Corresponds historically to ~58% below Fair Price.
Days since Genesis block are calculated automatically per bar.
3. What is displayed in the chart?
Fair Price Average power law line (“fair price”) Blue
Bottom Price Lower support (“floor”) Green
Power Law Corridor Filled area between 0.1× and 2.5× Fair Price Light blue (transparent)
Table (top right) Daily values as on the website Black with white text
Label (for >20% deviation) Shows current prices + percentage Red (overvalued) / Green (undervalued)
4. Recommended use Timeframe
Recommendation Weekly / Monthly Best long-term signals
Daily Good balance
Log scale Be sure to activate! (Right-click on Y-axis → “Logarithmic scale”)
5. Strategy tips (based on the model)
Price near bottom --> Buy / accumulate
Price > 2.5× fair price --> Sell part of position / caution
Price between fair & bottom --> Strong buy zone
Deviation < -20% --> HODL signal
开源脚本
本着TradingView的真正精神,此脚本的创建者将其开源,以便交易者可以查看和验证其功能。向作者致敬!虽然您可以免费使用它,但请记住,重新发布代码必须遵守我们的网站规则。
免责声明
这些信息和出版物并不意味着也不构成TradingView提供或认可的金融、投资、交易或其它类型的建议或背书。请在使用条款阅读更多信息。
开源脚本
本着TradingView的真正精神,此脚本的创建者将其开源,以便交易者可以查看和验证其功能。向作者致敬!虽然您可以免费使用它,但请记住,重新发布代码必须遵守我们的网站规则。
免责声明
这些信息和出版物并不意味着也不构成TradingView提供或认可的金融、投资、交易或其它类型的建议或背书。请在使用条款阅读更多信息。