INVITE-ONLY SCRIPT
已更新 [blackcat] L4 Dynamic Trend Analysis
█ OVERVIEW
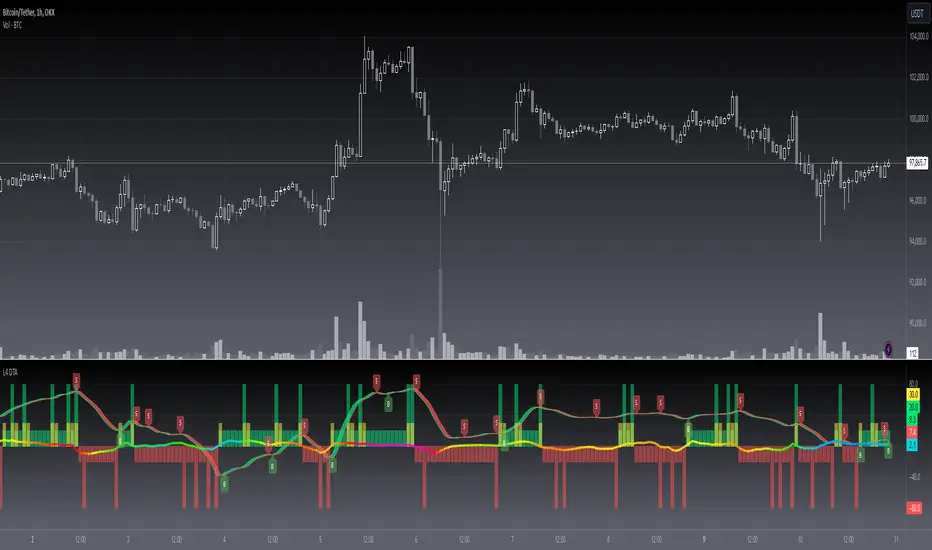
The script implements a dynamic trend analysis indicator named [blackcat] L4 Dynamic Trend Analysis (L4 DTA). It uses a combination of Exponential Moving Averages (EMA), Relative Strength Index (RSI), and custom functions to determine the trend direction and strength. The primary function is to visually represent the trend conditions and potential entry points on the chart.
█ FEATURES
• Initializes a gradient color array and populates it with a spectrum of colors. This gradient is used for coloring the power trend line based on the RSI value.
• Calculates the Average Linear Moving Average (ALMA) of the closing price.
• Computes the RSI of the ALMA value.
• Retrieves a color from the gradient array based on the RSI value.
• Defines a custom function dynamic_trend_analysis that calculates various trend indicators.
• Utilizes the plot function to display different trend conditions and signals on the chart.
• Adds labels to indicate short ('S') and long ('B') signals based on the trend conditions.
█ HOW TO USE
The script begins by defining the gradient color array.
It then calculates the ALMA and RSI values.
The dynamic_trend_analysis function is called, which computes several trend indicators.
Based on these indicators, the script plots different signals and trend lines on the chart.
Labels are added to indicate short and long signals when specific conditions are met.
█ CUSTOM FUNCTIONS
1 — xrf(values, length)
• Purpose: Retrieves the most recent non-NaN value from an array within a specified length.
• Parameters: values (array of float values), length (integer).
• Return Value: The most recent non-NaN value from the array within the specified length.
2 — xbs(cond, lkb)
• Purpose: Checks a condition over a specified lookback period and returns a boolean value.
• Parameters: cond (boolean condition), lkb (lookback period).
• Return Value: Boolean value indicating whether the condition was met over the lookback period.
3 — dynamic_trend_analysis(high, low, close)
• Purpose: Computes several trend indicators including short-side and long-side prices, crossovers, trend strength, and power trend.
• Parameters: high, low, close (price series).
• Return Value: An array containing trend strength (cc), moving average (ma1), trend (trend), and power trend (power_trend).
█ NOTES
• Gradient Color Array: The script uses a gradient color array to dynamically color the power trend line based on the RSI value, providing a visual indication of momentum.
• Custom Functions: The use of custom functions (xrf, xbs, dynamic_trend_analysis) encapsulates complex logic, making the script modular and easier to maintain.
• Trend Analysis: The script combines multiple indicators (EMA, RSI) to create a comprehensive trend analysis, providing multiple signals for trading decisions.
• Efficient Plotting: The script uses conditional plotting to display signals only when specific conditions are met, reducing clutter on the chart.
• Modifications: The script can be modified to include additional indicators or adjust the parameters of existing ones to better suit different trading styles or market conditions.
• Extensions: The dynamic trend analysis function can be extended to include more sophisticated trend following or reversal strategies.
• Alternative Uses: Similar techniques can be applied to other types of technical analysis, such as volatility analysis or momentum strategies.
• Related Concepts: Understanding of Pine Script functions like array.push, ta.ema, ta.rsi, and plot is beneficial for enhancing and customizing the script. Additionally, knowledge of conditional plotting and label creation can help in refining the visual output.
版本注释
Correct a little bug版本注释
reduce lag issue仅限邀请脚本
只有作者授权的用户才能访问此脚本。您需要申请并获得使用许可。通常情况下,付款后即可获得许可。更多详情,请按照下方作者的说明操作,或直接联系blackcat1402。
TradingView不建议您付费购买或使用任何脚本,除非您完全信任其作者并了解其工作原理。您也可以在我们的社区脚本找到免费的开源替代方案。
作者的说明
″
Get Free Trail Permission: discord.com/invite/ZTGpQJq
Avoid losing contact!Don't miss out! The first and most important thing to do is to join my Discord chat now! Click here to start your adventure: discord.com/invite/ZTGpQJq 防止失联,请立即行动,加入本猫聊天群: discord.com/invite/ZTGpQJq
免责声明
这些信息和出版物并非旨在提供,也不构成TradingView提供或认可的任何形式的财务、投资、交易或其他类型的建议或推荐。请阅读使用条款了解更多信息。
仅限邀请脚本
只有作者授权的用户才能访问此脚本。您需要申请并获得使用许可。通常情况下,付款后即可获得许可。更多详情,请按照下方作者的说明操作,或直接联系blackcat1402。
TradingView不建议您付费购买或使用任何脚本,除非您完全信任其作者并了解其工作原理。您也可以在我们的社区脚本找到免费的开源替代方案。
作者的说明
″
Get Free Trail Permission: discord.com/invite/ZTGpQJq
Avoid losing contact!Don't miss out! The first and most important thing to do is to join my Discord chat now! Click here to start your adventure: discord.com/invite/ZTGpQJq 防止失联,请立即行动,加入本猫聊天群: discord.com/invite/ZTGpQJq
免责声明
这些信息和出版物并非旨在提供,也不构成TradingView提供或认可的任何形式的财务、投资、交易或其他类型的建议或推荐。请阅读使用条款了解更多信息。