OPEN-SOURCE SCRIPT
3M_RANGE/ErkOzi/
Hello Dear Investors,
Today, I'd like to introduce you to an indicator called "3M Range" and explain how this indicator is calculated, as well as the kind of strategy it can offer.
What is the 3M Range Indicator?
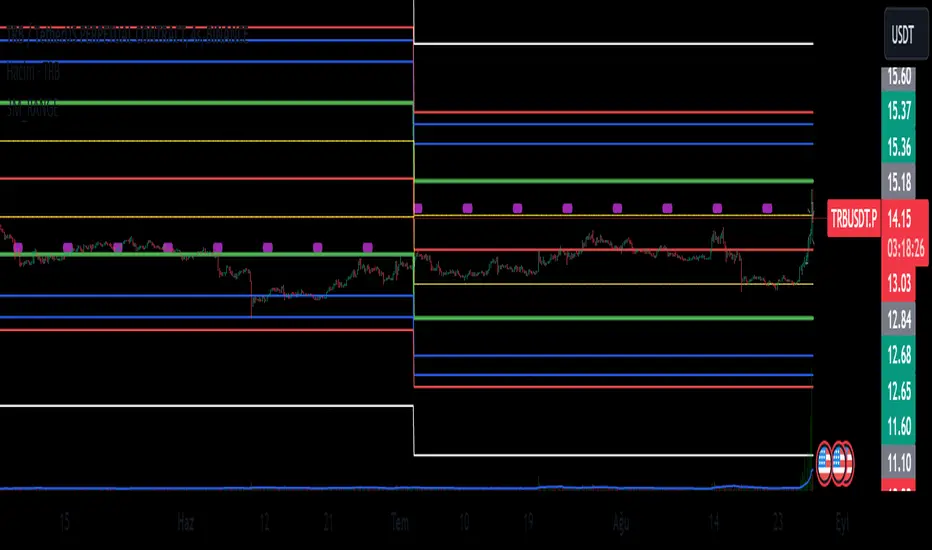
"3M Range" is an analytical tool designed to identify and visualize market movements within three-month periods. This indicator employs specific levels and Fibonacci levels to assist investors in understanding market trends.
How is it Calculated?
The indicator utilizes the opening, highest, and lowest prices of three-month periods starting on Mondays. By using these prices, the indicator tracks weekly opening prices and marks the opening prices every Monday.
How Does the Indicator's Strategy Work?
Using this indicator, you can refine your long-term investment strategies:
Identify Three-Month Periods: The indicator follows the opening, highest, and lowest prices in three-month periods. This allows for a clearer understanding of long-term trends.
Utilize Fibonacci Levels: The indicator calculates Fibonacci levels to show support and resistance levels. These levels can help predict potential reversals or ongoing movements.
Observe Monday Opening Prices: The indicator distinctly marks Monday opening prices. This helps you capture potential movements at the beginning of the week.
Evaluate Trends and Opportunities: By using the indicator, you can observe long-term trends and potential market opportunities more clearly.
In Conclusion,
The "3M Range" indicator provides long-term investors with a better analytical tool by showcasing market movements within three-month periods. The indicator marks Monday opening prices and allows for analysis supported by Fibonacci levels. By using this indicator, you can shape your long-term investment strategies more consciously.
Always remember that, as with anything, making careful and informed decisions is crucial when investing. I hope this indicator helps you better navigate your long-term investments.
Note: Understanding market risks and utilizing analytical tools carefully is always important. Best of luck!
Today, I'd like to introduce you to an indicator called "3M Range" and explain how this indicator is calculated, as well as the kind of strategy it can offer.
What is the 3M Range Indicator?
"3M Range" is an analytical tool designed to identify and visualize market movements within three-month periods. This indicator employs specific levels and Fibonacci levels to assist investors in understanding market trends.
How is it Calculated?
The indicator utilizes the opening, highest, and lowest prices of three-month periods starting on Mondays. By using these prices, the indicator tracks weekly opening prices and marks the opening prices every Monday.
How Does the Indicator's Strategy Work?
Using this indicator, you can refine your long-term investment strategies:
Identify Three-Month Periods: The indicator follows the opening, highest, and lowest prices in three-month periods. This allows for a clearer understanding of long-term trends.
Utilize Fibonacci Levels: The indicator calculates Fibonacci levels to show support and resistance levels. These levels can help predict potential reversals or ongoing movements.
Observe Monday Opening Prices: The indicator distinctly marks Monday opening prices. This helps you capture potential movements at the beginning of the week.
Evaluate Trends and Opportunities: By using the indicator, you can observe long-term trends and potential market opportunities more clearly.
In Conclusion,
The "3M Range" indicator provides long-term investors with a better analytical tool by showcasing market movements within three-month periods. The indicator marks Monday opening prices and allows for analysis supported by Fibonacci levels. By using this indicator, you can shape your long-term investment strategies more consciously.
Always remember that, as with anything, making careful and informed decisions is crucial when investing. I hope this indicator helps you better navigate your long-term investments.
Note: Understanding market risks and utilizing analytical tools carefully is always important. Best of luck!
开源脚本
秉承TradingView的精神,该脚本的作者将其开源,以便交易者可以查看和验证其功能。向作者致敬!您可以免费使用该脚本,但请记住,重新发布代码须遵守我们的网站规则。
免责声明
这些信息和出版物并非旨在提供,也不构成TradingView提供或认可的任何形式的财务、投资、交易或其他类型的建议或推荐。请阅读使用条款了解更多信息。
免责声明
这些信息和出版物并非旨在提供,也不构成TradingView提供或认可的任何形式的财务、投资、交易或其他类型的建议或推荐。请阅读使用条款了解更多信息。