OPEN-SOURCE SCRIPT
AI+ Scalper [BigMoneyMazz Enhanced]
Overview:
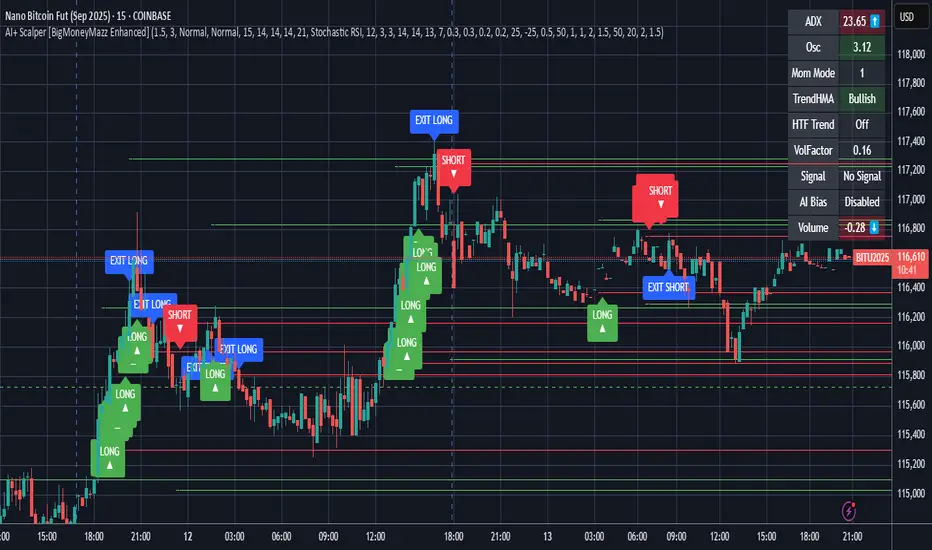
A professional-grade multi-factor trading indicator that combines trend, momentum, volatility, and volume analysis into a single composite oscillator. It provides clear visual buy/sell signals on your chart with automatic stop-loss and take-profit levels.
How It Works:
4-Way Market Analysis: Analyzes trend strength (ADX), momentum (your choice of 3 oscillators), volatility (ATR), and volume (OBV)
Smart Signal Generation: Only generates signals when multiple factors align (price above/below dynamic thresholds, trend confirmation, and sufficient volatility)
Visual Trading Plan: Plots clear LONG/SHORT labels on your chart with dashed lines showing exact stop-loss (red) and take-profit (green) levels
Live Dashboard: Real-time monitoring of all market conditions in a handy table
Key Features:
🎯 Clear Chart Signals: Green "LONG" and red "SHORT" labels with arrows
⚡ Risk Management: Automatic ATR-based stop-loss and take-profit levels
📊 Smart Dashboard: All key metrics in one view (ADX, Oscillator, Trend, Volume)
🔒 Non-Repainting: Uses only confirmed closing prices for reliable signals
⚙️ Fully Customizable: Adjust every aspect to your trading style
Recommended Settings for Day Trading:
Timeframe: 5-15 minutes
ATR Multiplier SL: 1.5 (tight stop)
ATR Multiplier TP: 3.0 (2:1 risk-reward)
Momentum Mode: Stochastic RSI (most responsive)
Use HTF Filter: ON (15-minute timeframe)
Latching Mode: ON (avoids whipsaws)
Recommended Settings for Swing Trading:
Timeframe: 1H-4H
ATR Multiplier SL: 2.0
ATR Multiplier TP: 4.0 (2:1 risk-reward)
Momentum Mode: Fisher RSI (smoother)
Use HTF Filter: ON (4H or Daily timeframe)
Latching Mode: ON
How to Use:
Wait for LONG/SHORT labels to appear on your chart
Enter trade when price touches your preferred entry level
Set stop-loss at the red dashed line
Set take-profit at the green dashed line
Use the dashboard to confirm market conditions (ADX > 25 = strong trend)
Signal Interpretation:
LONG ▲: Strong buy signal - trend bullish, oscillator above upper threshold
SHORT ▼: Strong sell signal - trend bearish, oscillator below lower threshold
EXIT: Close position (SL/TP hit)
Pro Tip: The dashboard is your best friend! Check that ADX is above 25 (strong trend) and volume is confirming before entering any trade.
This indicator works best as a confirmation tool alongside your existing strategy rather than a completely automated system. Always practice proper risk management!
开源脚本
本着TradingView的真正精神,此脚本的创建者将其开源,以便交易者可以查看和验证其功能。向作者致敬!虽然您可以免费使用它,但请记住,重新发布代码必须遵守我们的网站规则。
免责声明
这些信息和出版物并不意味着也不构成TradingView提供或认可的金融、投资、交易或其它类型的建议或背书。请在使用条款阅读更多信息。
开源脚本
本着TradingView的真正精神,此脚本的创建者将其开源,以便交易者可以查看和验证其功能。向作者致敬!虽然您可以免费使用它,但请记住,重新发布代码必须遵守我们的网站规则。
免责声明
这些信息和出版物并不意味着也不构成TradingView提供或认可的金融、投资、交易或其它类型的建议或背书。请在使用条款阅读更多信息。