OPEN-SOURCE SCRIPT
已更新 RSI OS/OS Levels MTF

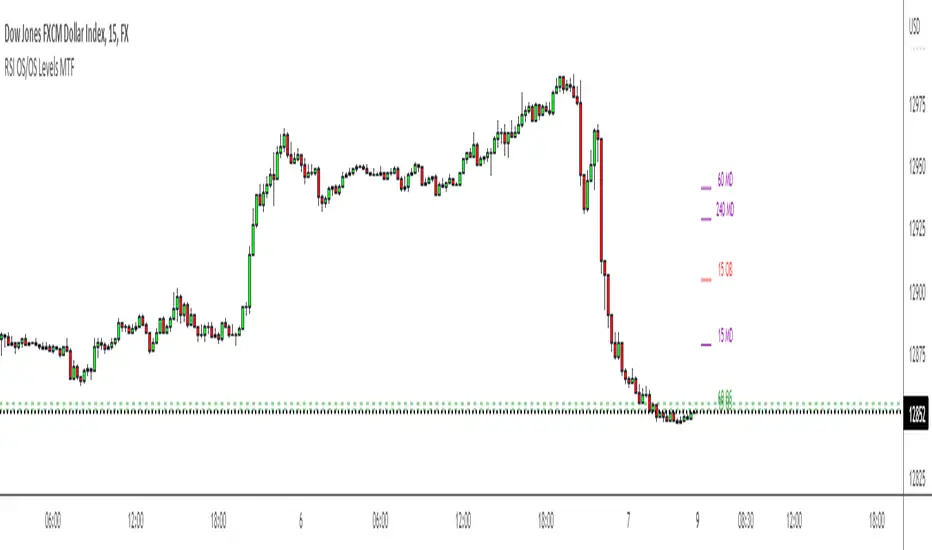
This plots the overbought and oversold (70 and 30) levels from RSI on price, there are often levels where a market will bounce or retrace/reverse.
By default it shows 15 min, 60 min and 4 hour levels but I intend to make these configurable along with some other stuff. For now it works how I use it, nice and simple
By default it shows 15 min, 60 min and 4 hour levels but I intend to make these configurable along with some other stuff. For now it works how I use it, nice and simple
版本注释
Added second colour, fixed labels版本注释
Added a feature that expands the lines to be dotted and the width of the chart when price gets close, to highlight potential bounce areas. Updated some input descriptions
版本注释
Updated chart screenshot to show all six levels版本注释
Added timeframe selectionAdded midpoints (in purple) (as suggested in comments)
Change colours to red/green
Added option to show historical OS/OB/Mid levels (as suggested in comments)
版本注释
Added an option to show/hide each timeframe开源脚本
秉承TradingView的精神,该脚本的作者将其开源,以便交易者可以查看和验证其功能。向作者致敬!您可以免费使用该脚本,但请记住,重新发布代码须遵守我们的网站规则。
免责声明
这些信息和出版物并非旨在提供,也不构成TradingView提供或认可的任何形式的财务、投资、交易或其他类型的建议或推荐。请阅读使用条款了解更多信息。
开源脚本
秉承TradingView的精神,该脚本的作者将其开源,以便交易者可以查看和验证其功能。向作者致敬!您可以免费使用该脚本,但请记住,重新发布代码须遵守我们的网站规则。
免责声明
这些信息和出版物并非旨在提供,也不构成TradingView提供或认可的任何形式的财务、投资、交易或其他类型的建议或推荐。请阅读使用条款了解更多信息。