PROTECTED SOURCE SCRIPT
Price Action [SignalCave]
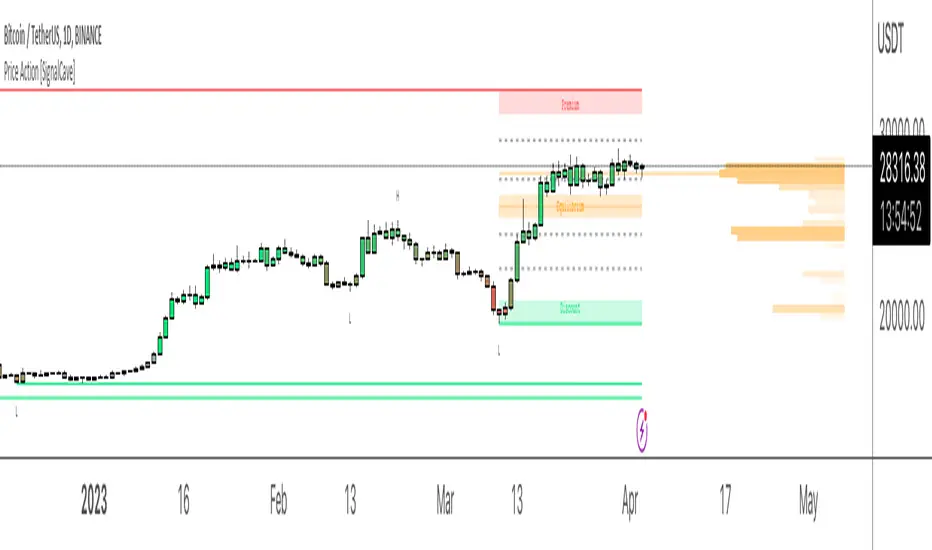
Liquidation prices are calculated with Higher Timeframe usage of "Williams Fractals" indicator.
Sell side liquidity levels are shown with "L" text and a green solid lines.
Buy side liquidity levels are shown with "H" text and a red solid lines.
Premium and Discount zones are determined with latest untested buy/sell liquidity levels.
"Premium" means the asset price is overvalued, "Discount" means the asset is undervalued.
Once price hits any active liquidity level, "Premium and Discount" zone will be recalculated.
Premium and Discount have "Equilibrium" area which is center area of the whole zone.
Extra Support & Resistance levels calculation are based on Fibonacci. Levels are 23.6%, 38.2%, 61.8% and 78.6%.
Bars are painted based on asset's momentum. The asset momentum is calculated by the RSI and ADX indicators.
Volume profile shows trade activity during the "Premium and Discount" zone.
受保护脚本
此脚本以闭源形式发布。 但是,您可以自由使用,没有任何限制 — 了解更多信息这里。
Pine Script Code Generator:
getpinescript.com/
Optimize Your TradingView Strategies:
pinetune.app
Trading Simulation Game:
Dare2Trade.com
Pine Script Job Proposals:
t.me/kriswaters
getpinescript.com/
Optimize Your TradingView Strategies:
pinetune.app
Trading Simulation Game:
Dare2Trade.com
Pine Script Job Proposals:
t.me/kriswaters
免责声明
这些信息和出版物并非旨在提供,也不构成TradingView提供或认可的任何形式的财务、投资、交易或其他类型的建议或推荐。请阅读使用条款了解更多信息。