INVITE-ONLY SCRIPT
已更新 SFC Macroeconomics
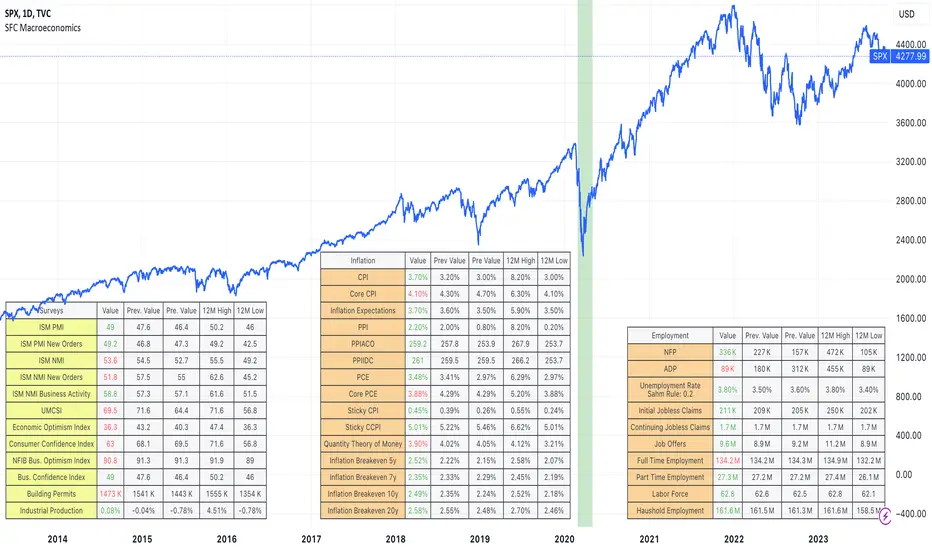
The Macroeconomics indicator can give us an instant view of the most important economic indicators. The indicator displays different tables in different sectors:
- Money : It give us a basic information about the money indicators in USA;
- Surveys: They are usually used as leading indicators.
- Inflation: It is showing overall inflation in the country
- Employment: Provides deep information about the current labor market
- Government: Usually legging indicators, but providing very good information about the USA
- Others: Few important indicators, for example GDP.
How we can use the indicator:
1) The indicator can be used to help traders, getting an instant overview of the economic indicators, helping them to create the Macroeconomic analysis.
2) The indicator can be use as a preparation before the high-impact news.
Note:
Yellow colour - leading indicators
Orange colour - legging indicators
Tables are showing the current data, also 12 months high and low. This is very important information, because it shows the extremes and normally if the current data is 12 months high or low it will be observed by the big players.
Before use this indicator, traders need basic macroeconomic understanding. A good knowledge is required in order to take advantage of the indicators and create the economic analysis or bias.
版本注释
-added ADP版本注释
- added historical recession- added Sahm Rule
- changed the overlay
版本注释
- new symbols added to give us a more detailed picture- transferred some of the data to another indicator
- Show more previous values to understand how data changes.
- added tooltips
仅限邀请脚本
只有作者授权的用户才能访问此脚本。您需要申请并获得使用许可。通常情况下,付款后即可获得许可。更多详情,请按照下方作者的说明操作,或直接联系SerpentForexClub。
TradingView不建议您付费购买或使用任何脚本,除非您完全信任其作者并了解其工作原理。您也可以在我们的社区脚本找到免费的开源替代方案。
作者的说明
Contact me through the PM system.
免责声明
这些信息和出版物并非旨在提供,也不构成TradingView提供或认可的任何形式的财务、投资、交易或其他类型的建议或推荐。请阅读使用条款了解更多信息。
仅限邀请脚本
只有作者授权的用户才能访问此脚本。您需要申请并获得使用许可。通常情况下,付款后即可获得许可。更多详情,请按照下方作者的说明操作,或直接联系SerpentForexClub。
TradingView不建议您付费购买或使用任何脚本,除非您完全信任其作者并了解其工作原理。您也可以在我们的社区脚本找到免费的开源替代方案。
作者的说明
Contact me through the PM system.
免责声明
这些信息和出版物并非旨在提供,也不构成TradingView提供或认可的任何形式的财务、投资、交易或其他类型的建议或推荐。请阅读使用条款了解更多信息。