PROTECTED SOURCE SCRIPT
ICT Killzones with Market Behavior
Indicator Title: ICT Killzones with Market Behavior
Description:
Introducing the ICT Killzones with Market Behavior indicator, a powerful tool designed for traders looking to capitalize on key trading timeframes in the New York session.
Key Features:
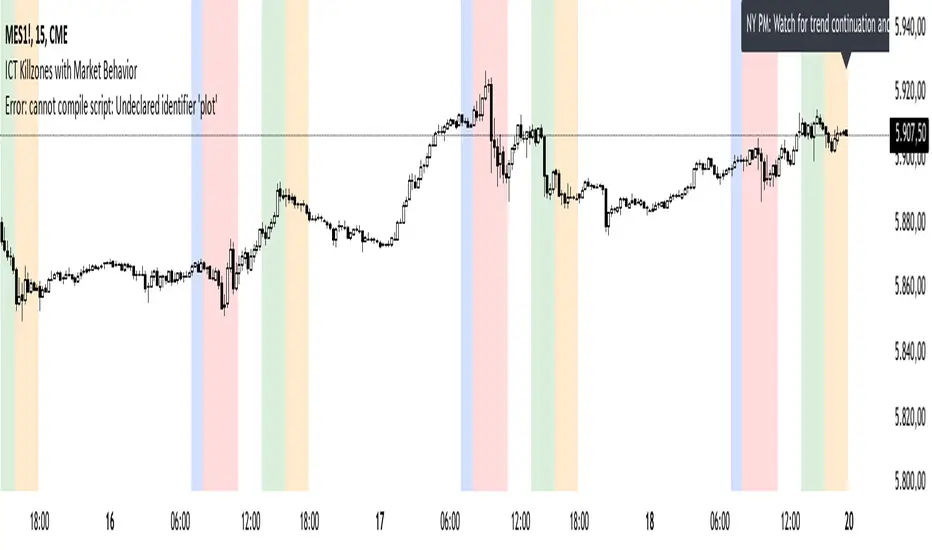
Visual Timeframes: This indicator highlights essential trading periods, including Pre-Market, NY Open, NY Lunch, and NY PM sessions. These visual markers help you quickly identify when the market is likely to experience heightened activity and liquidity.
Real-Time Insights: Stay informed with dynamic text displayed at the top of your chart. The indicator updates in real-time, providing actionable insights on what to expect during each session—whether it’s volatility, consolidation, or potential trend continuation.
Custom Color Options: Tailor the color settings for each killzone to fit your personal trading style and enhance the visual clarity of your chart.
User-Friendly Design: Built with simplicity in mind, this indicator integrates seamlessly into TradingView, making it easy for traders of all experience levels to utilize.
How to Use:
Add to Your Chart: Integrate the ICT Killzones with Market Behavior indicator into your TradingView setup.
Monitor Market Conditions: Keep an eye on the highlighted timeframes and the real-time insights displayed at the top. This information can guide your trading strategy effectively.
Adjust Your Approach: Use the insights from the indicator to modify your trading decisions based on the expected market behavior during each session.
Note: This indicator is for educational purposes only and should not be interpreted as financial advice. Always perform your own research and assess risks before making any trading decisions.
Description:
Introducing the ICT Killzones with Market Behavior indicator, a powerful tool designed for traders looking to capitalize on key trading timeframes in the New York session.
Key Features:
Visual Timeframes: This indicator highlights essential trading periods, including Pre-Market, NY Open, NY Lunch, and NY PM sessions. These visual markers help you quickly identify when the market is likely to experience heightened activity and liquidity.
Real-Time Insights: Stay informed with dynamic text displayed at the top of your chart. The indicator updates in real-time, providing actionable insights on what to expect during each session—whether it’s volatility, consolidation, or potential trend continuation.
Custom Color Options: Tailor the color settings for each killzone to fit your personal trading style and enhance the visual clarity of your chart.
User-Friendly Design: Built with simplicity in mind, this indicator integrates seamlessly into TradingView, making it easy for traders of all experience levels to utilize.
How to Use:
Add to Your Chart: Integrate the ICT Killzones with Market Behavior indicator into your TradingView setup.
Monitor Market Conditions: Keep an eye on the highlighted timeframes and the real-time insights displayed at the top. This information can guide your trading strategy effectively.
Adjust Your Approach: Use the insights from the indicator to modify your trading decisions based on the expected market behavior during each session.
Note: This indicator is for educational purposes only and should not be interpreted as financial advice. Always perform your own research and assess risks before making any trading decisions.
受保护脚本
此脚本以闭源形式发布。 但是,您可以自由使用,没有任何限制 — 了解更多信息这里。
免责声明
这些信息和出版物并非旨在提供,也不构成TradingView提供或认可的任何形式的财务、投资、交易或其他类型的建议或推荐。请阅读使用条款了解更多信息。
免责声明
这些信息和出版物并非旨在提供,也不构成TradingView提供或认可的任何形式的财务、投资、交易或其他类型的建议或推荐。请阅读使用条款了解更多信息。