PROTECTED SOURCE SCRIPT
已更新 WMA ATR CHECK Indicator
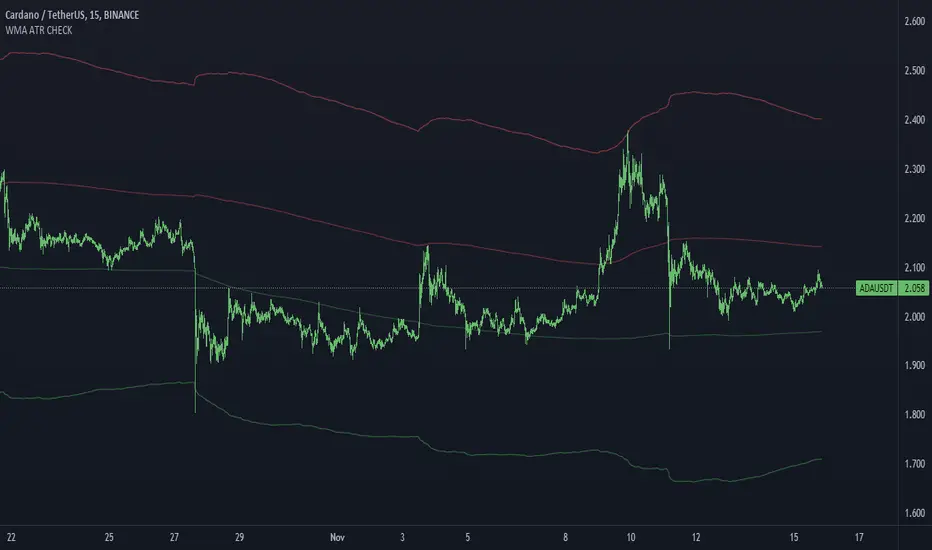
WMA ATR Check indicator:
With my knowledge of MOVING AVERAGE, I created a new average of ATR by dividing the average by the number of days or the number of candles I have.
It can indicate the possibility of support and resistance in the market or even a market reversal point.
It is very useful for people looking for support or resistance or selling points to buy.
The green line indicates the average ATR rate, processed with MOVING AVERAGE, can understand the market where it can go down.
The red line indicates the average ATR rate, processed by MOVING AVERAGE, can understand the market where it can go up.
By taking ATR *6 * 4 / MOVING AVERAGE *4 along the lines that everyone can see.
ด้วยความรู้ที่ผมมีเกี่ยวกับ MOVING AVERAGE ผมได้สร้างค่าเฉลี่ยใหม่ของ ATR โดยเอาไปมาหารค่าเฉลี่ยด้วยจำนวนวันหรือจำนวนแท่งเทียนที่มี
มันสามารถบอกถึงความเป็นไปได้ของแนวรับแนวต้านในตลาดหรือแม้แต่จุดกลับตัวของตลาด
มันมีประโยชน์มากสำหรับคนที่มองหาแนวรับหรือมองหาแนวต้านหรือจุดขายจุดซื้อ
เส้นสีเขียว บอกถึงอัตราค่าเฉลี่ยของ ATR ประมวลผลด้วย MOVING AVERAGE สามารถเข้าใจตลาดได้ว่าจะสามารถลงมาได้ถึงไหน
เส้นสีแดงบอกถึงอัตราค่าเฉลี่ยของ ATR ประมวลผลด้วย MOVING AVERAGE สามารถเข้าใจตลาดได้ว่าจะสามารถขึ้นไปได้ถึงไหน
โดยเอา ATR *6 * 4 / MOVING AVERAGE *4 ออกมาตามเส้นที่ทุกคนเห็น
版本注释
We can use ATR to read price frames. and plan in tradingWe've adjusted the color to make it look a bit lighter. for easy viewing of graphs
受保护脚本
此脚本以闭源形式发布。 但是,您可以自由使用,没有任何限制 — 了解更多信息这里。
免责声明
这些信息和出版物并非旨在提供,也不构成TradingView提供或认可的任何形式的财务、投资、交易或其他类型的建议或推荐。请阅读使用条款了解更多信息。
受保护脚本
此脚本以闭源形式发布。 但是,您可以自由使用,没有任何限制 — 了解更多信息这里。
免责声明
这些信息和出版物并非旨在提供,也不构成TradingView提供或认可的任何形式的财务、投资、交易或其他类型的建议或推荐。请阅读使用条款了解更多信息。