OPEN-SOURCE SCRIPT
Multi-Timeframe Closures with Signals month week day
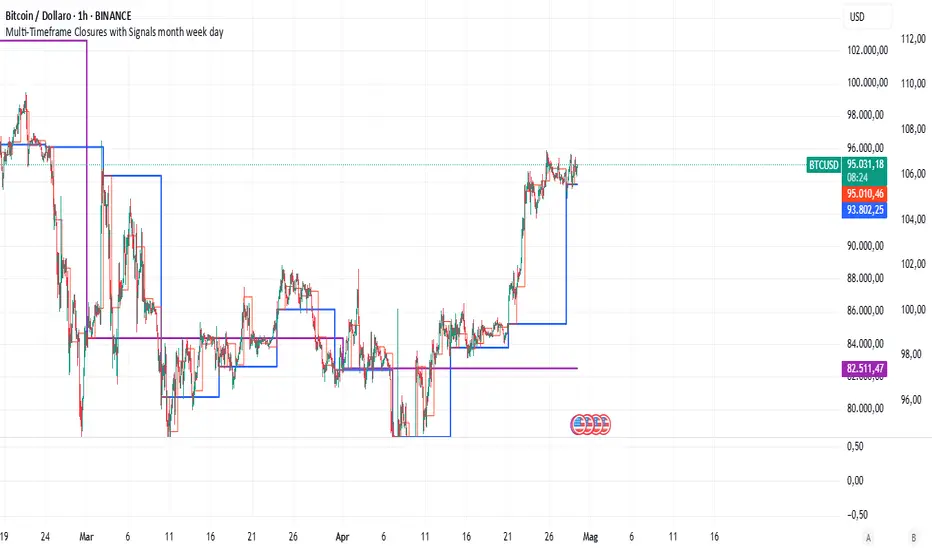
Multi-Timeframe Price Anchoring Indicator (Monthly, Weekly, Daily)
This indicator provides a powerful visual framework for analyzing price action across three major timeframes: monthly, weekly, and daily. It plots the closing prices of each timeframe directly on the chart to help traders assess where current price stands in relation to significant historical levels.
🔍 Core Features:
Monthly, Weekly, and Daily Close Lines: Automatically updated at the start of each new period.
Color-coded Price Anchors: Each timeframe is visually distinct for fast interpretation.
Multi-timeframe Awareness: Helps you identify trend alignment or divergence across different time horizons.
Long & Short Bias Signals: The script can optionally display long or short suggestions based on where the current price stands relative to the anchored closing prices.
📈 How to Use:
Trend Confirmation: If price is consistently above all three levels, it signals a strong bullish trend (potential long bias). If it’s below, the opposite applies (short bias).
Reversal or Pullback Zones: When price becomes extended far above/below the monthly and weekly closes, it may suggest overbought/oversold conditions and the possibility of a reversal or retracement.
Intraday Alignment: Useful for traders who want to enter positions on lower timeframes while being aware of higher timeframe trends.
This indicator is ideal for swing traders, day traders, and position traders who want to anchor their decisions to meaningful multi-timeframe reference points.
开源脚本
秉承TradingView的精神,该脚本的作者将其开源,以便交易者可以查看和验证其功能。向作者致敬!您可以免费使用该脚本,但请记住,重新发布代码须遵守我们的网站规则。
免责声明
这些信息和出版物并非旨在提供,也不构成TradingView提供或认可的任何形式的财务、投资、交易或其他类型的建议或推荐。请阅读使用条款了解更多信息。
免责声明
这些信息和出版物并非旨在提供,也不构成TradingView提供或认可的任何形式的财务、投资、交易或其他类型的建议或推荐。请阅读使用条款了解更多信息。