OPEN-SOURCE SCRIPT
已更新 Multi Timeframe Moving Average Selector
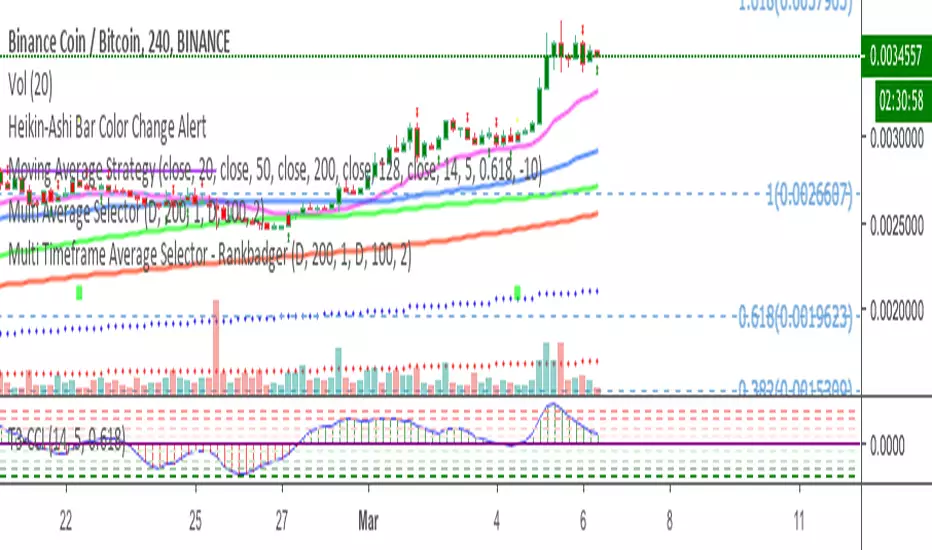
This allows you to plot a moving average on a different timeframe to the one you are viewing.
For instance if you are on a 4hr chart, you can plot the position of the daily 200MA, 100EMA etc
On a 15min chart you could plot where the hourly MAs are.
You can define the length of the MA and the style, EMA, SMA Hull MA etc, the colour and the type.
As with all my scripts I have pinched bits of other peoples and spliced them together with my own bits and bobs. Credit where it's due but I don't even know where most of this came from, it's pretty bothed together.
Feedback appreciated
版本注释
Update to include another MA defaults to 100EMA版本注释
Changed line to small dots so it stands out版本注释
update开源脚本
秉承TradingView的精神,该脚本的作者将其开源,以便交易者可以查看和验证其功能。向作者致敬!您可以免费使用该脚本,但请记住,重新发布代码须遵守我们的网站规则。
免责声明
这些信息和出版物并非旨在提供,也不构成TradingView提供或认可的任何形式的财务、投资、交易或其他类型的建议或推荐。请阅读使用条款了解更多信息。
开源脚本
秉承TradingView的精神,该脚本的作者将其开源,以便交易者可以查看和验证其功能。向作者致敬!您可以免费使用该脚本,但请记住,重新发布代码须遵守我们的网站规则。
免责声明
这些信息和出版物并非旨在提供,也不构成TradingView提供或认可的任何形式的财务、投资、交易或其他类型的建议或推荐。请阅读使用条款了解更多信息。