OPEN-SOURCE SCRIPT
已更新 [blackcat] L2 Auto MTF Pivot Forecast
Level 2
Background
A algo for pivot points forecast for each bar of automatic multiple timeframe (MTF) data.
Function
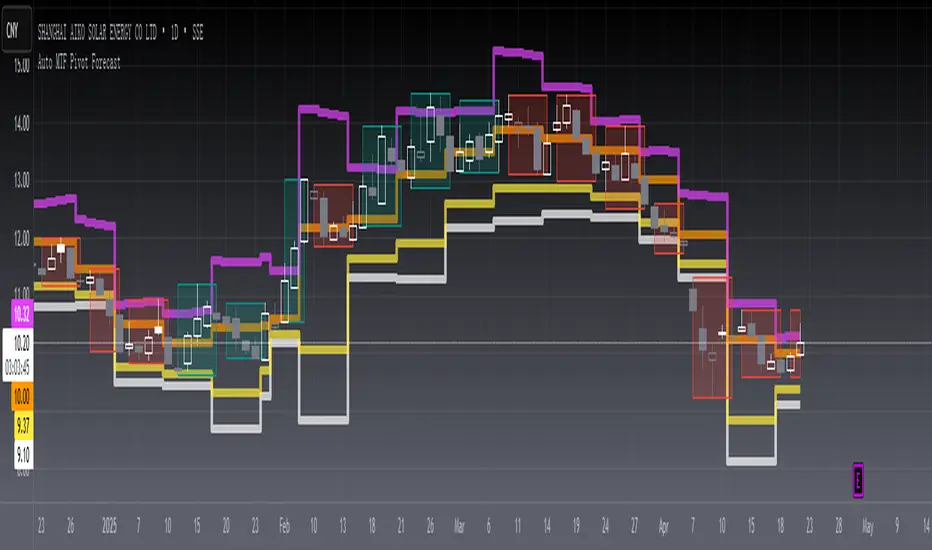
In financial markets, a pivot point is a price level that is used by traders as an indicator of market movement. Pivot points are averaged from important prices (highest, lowest, closing) based on the market performance of the previous time period. There are many ways to calculate the pivot point. The pivot point is calculated using the highest price (H), the lowest price (L) and the closing price (C) of the previous time period, and sometimes the opening price of the current time period Valence (O) was added to it.
S1 yellow
S2 white
R1 Orange
R2 fuchsia
The smoothing parameter default to 55
The pivot point indicator can be used in two ways. First, the pivot point can be used as a price trend confirmation. It is generally believed that if the price is above the pivot point in the latter period of time, the market is considered to be in a bull market sentiment, otherwise it is considered to be in a bear market sentiment. Second, support and resistance levels are mainly used as exit positions. For example, R1 and R2 can be used as trade targets if the market price breaks above a pivot point. If the market effectively breaks R1 and R2, traders may consider adding to their long positions.
Remarks
Feedbacks are appreciated.
Background
A algo for pivot points forecast for each bar of automatic multiple timeframe (MTF) data.
Function
In financial markets, a pivot point is a price level that is used by traders as an indicator of market movement. Pivot points are averaged from important prices (highest, lowest, closing) based on the market performance of the previous time period. There are many ways to calculate the pivot point. The pivot point is calculated using the highest price (H), the lowest price (L) and the closing price (C) of the previous time period, and sometimes the opening price of the current time period Valence (O) was added to it.
S1 yellow
S2 white
R1 Orange
R2 fuchsia
The smoothing parameter default to 55
The pivot point indicator can be used in two ways. First, the pivot point can be used as a price trend confirmation. It is generally believed that if the price is above the pivot point in the latter period of time, the market is considered to be in a bull market sentiment, otherwise it is considered to be in a bear market sentiment. Second, support and resistance levels are mainly used as exit positions. For example, R1 and R2 can be used as trade targets if the market price breaks above a pivot point. If the market effectively breaks R1 and R2, traders may consider adding to their long positions.
Remarks
Feedbacks are appreciated.
版本注释
OVERVIEWThe L2 Auto MTF Pivot Forecast is a comprehensive TradingView Pine Script that combines multiple technical analysis tools into one powerful indicator. It dynamically adjusts its timeframe based on your chart's resolution while providing automated pivot point calculations and price range visualization through colored boxes. The script supports three different calculation methods: High/Low Range, True Range, and Heikin Ashi Range. 📈📊
FEATURES
• Dynamic Timeframe Selection:
Automatically adapts to your chart's timeframe
Supports various timeframes from minutes to years
Uses optimal timeframes for each resolution level
• Multiple Calculation Methods:
🔄 High/Low Range (Default): Basic high-low price ranges
🔗 True Range: Incorporates prior closing prices
🎯 Heikin Ashi Range: Based on Heikin Ashi candlesticks
• Pivot Point Analysis:
Calculates dynamic support and resistance levels
Provides four distinct pivot levels (s1, s2, r1, r2)
Smoothed calculations using adjustable periods
• Visual Indicators:
Color-coded price action boxes
Different colors for bullish and bearish movements
Steplined plots for pivot points
HOW TO USE
Setup Configuration:
Enable/disable automatic timeframe selection
Choose preferred calculation method
Adjust smoothing period for pivot calculations
Interpretation Guide:
Green/Blue boxes indicate upward momentum
Red/Purple boxes signal downward pressure
Watch for pivot points intersections with price action
Customization Options:
Modify box colors and transparency
Adjust line styles for pivot points
Fine-tune timeframe settings
LIMITATIONS
⚠️ Note that this indicator may lag slightly due to security requests across different timeframes.
开源脚本
秉承TradingView的精神,该脚本的作者将其开源,以便交易者可以查看和验证其功能。向作者致敬!您可以免费使用该脚本,但请记住,重新发布代码须遵守我们的网站规则。
Avoid losing contact!Don't miss out! The first and most important thing to do is to join my Discord chat now! Click here to start your adventure: discord.com/invite/ZTGpQJq 防止失联,请立即行动,加入本猫聊天群: discord.com/invite/ZTGpQJq
免责声明
这些信息和出版物并非旨在提供,也不构成TradingView提供或认可的任何形式的财务、投资、交易或其他类型的建议或推荐。请阅读使用条款了解更多信息。