PROTECTED SOURCE SCRIPT
已更新 Lite Trading Diary : equity curve
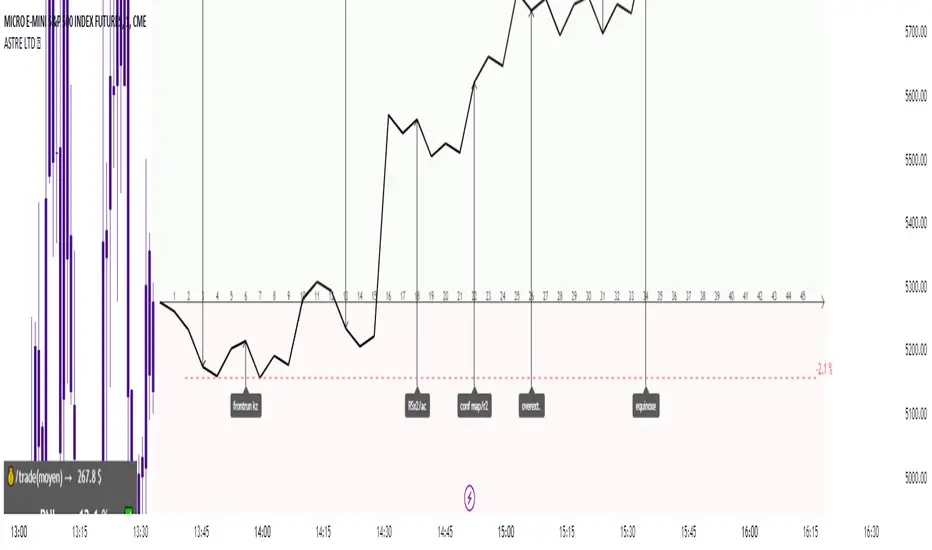
Dynamic trading journal with equity curve display. Detailed results with prop firm objectives, editable, $/month estimation, possibility to compare two strategies.
one line in parameter = one trade.
For each trade, specify : RR (Win, or "-1" for a stoploss), type of trade, and a comment.
The bottom left table summarizes the overall performance with some key information. RA return => Risk adjusted performance.
there is the possibility to define a "Type" : type 1, 2 or 3. It allows to split the equity curve. You can thus distinguish the different sub-strategies of your strategy, visually see their effectiveness, and be able to adjust your risk exposure accordingly.
Learn from your backtests. Identify your strengths, your weaknesses, and improve!
All the conditions to succeed in the challenge are adjustable in the parameters. Please note : drawdown on the equity curve is max drawdown. On the table => static drawdown.
Use "A random day trading" indicator to spice up your training.
I hope this will be useful for you to track your performance !
版本注释
fix picture受保护脚本
此脚本以闭源形式发布。 但是,您可以自由使用,没有任何限制 — 了解更多信息这里。
Most aggressive TradingView/MT4/MT5 trading setup on the market. Pure juice concentrated from SMC/ICT, divergences and PA!
Snipe the institutional levels! 🐋🏹
Snipe the institutional levels! 🐋🏹
免责声明
这些信息和出版物并非旨在提供,也不构成TradingView提供或认可的任何形式的财务、投资、交易或其他类型的建议或推荐。请阅读使用条款了解更多信息。
受保护脚本
此脚本以闭源形式发布。 但是,您可以自由使用,没有任何限制 — 了解更多信息这里。
Most aggressive TradingView/MT4/MT5 trading setup on the market. Pure juice concentrated from SMC/ICT, divergences and PA!
Snipe the institutional levels! 🐋🏹
Snipe the institutional levels! 🐋🏹
免责声明
这些信息和出版物并非旨在提供,也不构成TradingView提供或认可的任何形式的财务、投资、交易或其他类型的建议或推荐。请阅读使用条款了解更多信息。