PROTECTED SOURCE SCRIPT
Relative Open Interest - Tradingriot
Relative Open Interest
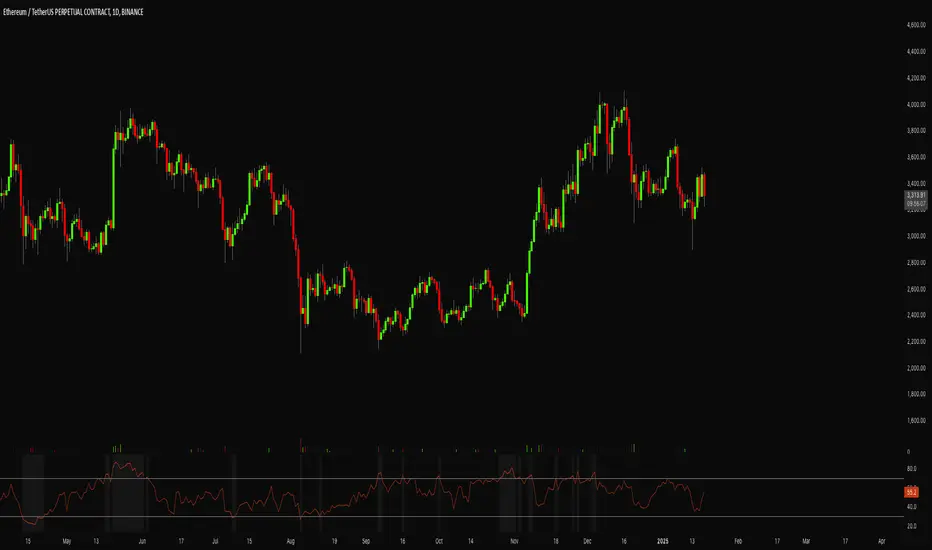
This indicator presents a normalized visualization of Open Interest, employing methodology similar to oscillators like RSI.
It transforms raw Open Interest data into an intuitive format that helps identify significant shifts in market positioning within perpetual futures markets.
Overbought Territory (>70)
When the indicator enters overbought territory, it signals substantial new directional perpetuals futures increase in the market.
This surge in positioning can signal two potential scenarios:
Momentum Continuation: The influx of new participants reinforces the existing trend
Mean Reversion: The rapid accumulation of positions creates conditions for a potential reversal
Oversold Territory (<30)
Oversold readings indicate a significant reduction in open positions, typically through a combination of:
These conditions often present compelling mean reversion opportunities as the market digests this rapid position reduction.
Implementation Framework
While this indicator provides valuable insights into market positioning dynamics, it should be integrated within a comprehensive analytical framework rather than used in isolation.
The signals it generates are most effective when confirmed by complementary technical and fundamental analysis tools.
The indicator's strength lies in its ability to quantify and visualize significant changes in market participation, offering traders a sophisticated metric for understanding potential market inflection points and positioning dynamics.
Can be used on any timeframe with any lookback, make sure to backtest the settings that work best for you.
Do not forget that indicator only works when used on Binance perpetual futures charts.
This indicator presents a normalized visualization of Open Interest, employing methodology similar to oscillators like RSI.
It transforms raw Open Interest data into an intuitive format that helps identify significant shifts in market positioning within perpetual futures markets.
Overbought Territory (>70)
When the indicator enters overbought territory, it signals substantial new directional perpetuals futures increase in the market.
This surge in positioning can signal two potential scenarios:
Momentum Continuation: The influx of new participants reinforces the existing trend
Mean Reversion: The rapid accumulation of positions creates conditions for a potential reversal
Oversold Territory (<30)
Oversold readings indicate a significant reduction in open positions, typically through a combination of:
- Voluntary position closures
- Stop-loss triggers
- Forced liquidations
These conditions often present compelling mean reversion opportunities as the market digests this rapid position reduction.
Implementation Framework
While this indicator provides valuable insights into market positioning dynamics, it should be integrated within a comprehensive analytical framework rather than used in isolation.
The signals it generates are most effective when confirmed by complementary technical and fundamental analysis tools.
The indicator's strength lies in its ability to quantify and visualize significant changes in market participation, offering traders a sophisticated metric for understanding potential market inflection points and positioning dynamics.
Can be used on any timeframe with any lookback, make sure to backtest the settings that work best for you.
Do not forget that indicator only works when used on Binance perpetual futures charts.
受保护脚本
此脚本以闭源形式发布。 但是,您可以自由使用,没有任何限制 — 了解更多信息这里。
免责声明
这些信息和出版物并非旨在提供,也不构成TradingView提供或认可的任何形式的财务、投资、交易或其他类型的建议或推荐。请阅读使用条款了解更多信息。
受保护脚本
此脚本以闭源形式发布。 但是,您可以自由使用,没有任何限制 — 了解更多信息这里。
免责声明
这些信息和出版物并非旨在提供,也不构成TradingView提供或认可的任何形式的财务、投资、交易或其他类型的建议或推荐。请阅读使用条款了解更多信息。