OPEN-SOURCE SCRIPT
Relative Valuation Oscillator
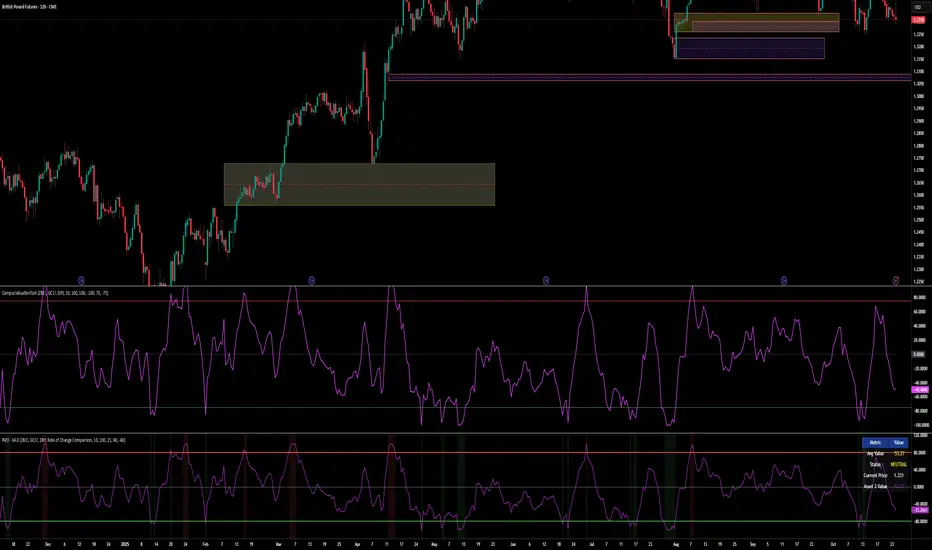
This is a Relative Valuation Oscillator (RVO) this is attempt of replication OTC Valuation - a sophisticated multi-asset comparison indicator designed to measure whether the current asset is overvalued or undervalued relative to up to three reference assets.
Overview
The RVO compares the current chart's asset against reference assets (default: 30-Year Treasury Bonds, Gold, and US Dollar Index) to determine relative strength and valuation extremes. It outputs normalized oscillator values ranging from -100 (undervalued) to +100 (overvalued).
Key Features
Multiple Calculation Methods
The indicator offers 5 different calculation approaches:
Simple Ratio - Normalized ratio deviation from average
Percentage Difference - Percentage change comparison
Ratio Z-Score - Standard deviation-based comparison
Rate of Change Comparison - Momentum differential analysis (default)
Normalized Ratio - Min-max normalized ratio
Configurable Reference Assets
Asset 1: Default ZB (30-Year Treasury Bond Futures) - tracks interest rate sensitivity
Asset 2: Default GC (Gold Futures) - tracks safe-haven and inflation dynamics
Asset 3: Default DXY (US Dollar Index) - tracks currency strength
Each asset can be enabled/disabled independently
Fully customizable symbols
Visual Components
Multiple oscillator lines - One for each active reference asset (color-coded)
Average line - Combined signal from all active assets
Overbought/Oversold zones - Configurable threshold levels (default: ±80)
Zero line - Neutral valuation reference
Background coloring - Visual zones for extreme conditions
Signal line - Optional smoothed average
Entry markers - Long/short signals at key reversals
Signal Generation
Crossover alerts - When crossing overbought/oversold levels
Entry signals - Reversals from extreme zones
Divergence detection - Bullish/bearish divergences between price and oscillator
Zero-line crosses - Trend strength changes
Customization Options
Lookback period (10-500): Controls statistical calculation window
Normalization period (50-1000): Determines scaling sensitivity
Smoothing toggle: Optional EMA/SMA smoothing with adjustable period
Visual customization: Colors, levels, and display options
Information Table
Real-time dashboard showing:
Average oscillator value
Current status (Overvalued/Undervalued/Neutral)
Current asset price
Individual values for each active reference asset
Use Cases
Mean reversion trading - Identify extreme relative valuations for reversal trades
Sector rotation - Compare assets within similar categories
Hedging strategies - Understand correlation dynamics
Multi-asset analysis - Simultaneously compare against bonds, commodities, and currencies
Divergence trading - Spot price/oscillator divergences
Trading Strategy Applications
Long signals: When oscillator crosses above oversold level (asset recovering from undervaluation)
Short signals: When oscillator crosses below overbought level (asset declining from overvaluation)
Confirmation: Use multiple reference assets for stronger signals
Risk management: Avoid trading when all assets show neutral readings
This indicator is particularly useful for traders who want to incorporate inter-market analysis and relative strength concepts into their trading decisions, especially in OTC (Over-The-Counter) and futures markets.
开源脚本
秉承TradingView的精神,该脚本的作者将其开源,以便交易者可以查看和验证其功能。向作者致敬!您可以免费使用该脚本,但请记住,重新发布代码须遵守我们的网站规则。
免责声明
这些信息和出版物并非旨在提供,也不构成TradingView提供或认可的任何形式的财务、投资、交易或其他类型的建议或推荐。请阅读使用条款了解更多信息。
开源脚本
秉承TradingView的精神,该脚本的作者将其开源,以便交易者可以查看和验证其功能。向作者致敬!您可以免费使用该脚本,但请记住,重新发布代码须遵守我们的网站规则。
免责声明
这些信息和出版物并非旨在提供,也不构成TradingView提供或认可的任何形式的财务、投资、交易或其他类型的建议或推荐。请阅读使用条款了解更多信息。