INVITE-ONLY SCRIPT
SVX (Sentiment Velocity Index) EMA & Slope Structure
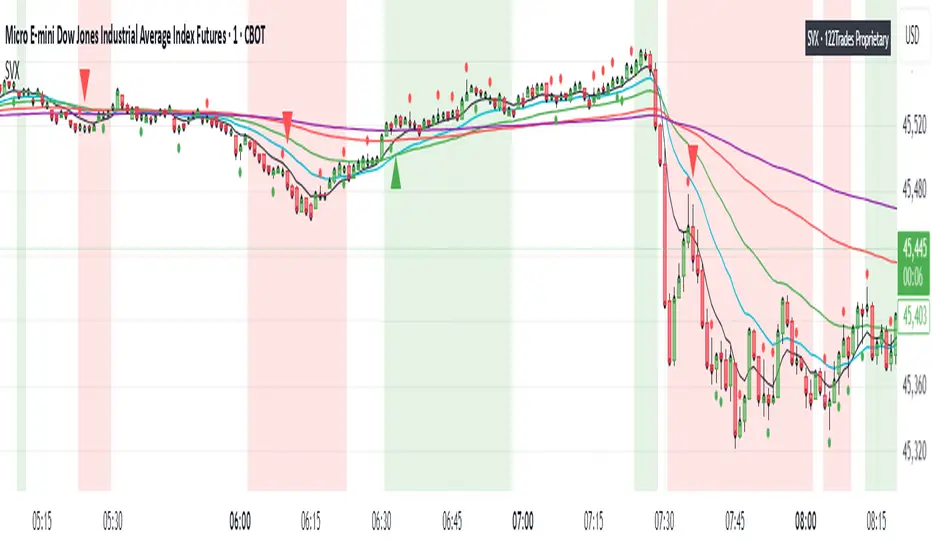
The SVX Momentum Framework is designed as a momentum and slope visualization tool. Designed to identify momentum shifts and pre-move conditions within price action.
What it draws:
- Plots five EMAs (8, 20, 40, 100, 200) To visualize short/medium trend structure. You can pick which ones to see.
- Calculates an EMA-based slope (rate of change) from actual closing-price movement and colors a neutral/positive/negative background for context. This is not ATR or Supertrend.
- Shows optional triangle context markers on bars that meet wick/body conditions that often precede momentum transitions (off by default / user-controlled).
- Shows Reference close (optional): Use when you need to verify price relative to standard closes for easier zone and level marking.
How the components work together:
- The EMA stack provides directional alignment (compression/expansion and relative order of 8/20/40/100/200).
- The slope quantifies whether recent movement is neutral, building (Green), or fading (Red); the background simply reflects that state.
- The triangle context markers flag a bar-shape condition (wick/body relationship) that can precede changes in behavior.
- The reference close is a visual aid for clarity when users compare candle closes and trading zones or levels .
How to read it:
- Structure: Look for EMA ordering (at least 8/20/100 recommended) and spacing to understand the underlying bias and compression/expansion.
- Slope state: Neutral (no bias, white), positive (building, green), or negative (fading, red). Use it as context, not as entries/exits.
- Context markers (optional): Treat them as visual highlights.
- Reference close (optional): Use when you need to verify price relative to candle close for easier zone and level marking.
How to use it (general guidance):
- Read structure first (EMA order/spread), then consider the slope state to understand whether conditions are neutral or possibly momentum-driven in the indicated direction.
- Combine with your own entry rules and/or engulfing candle patterns for timing, risk, and apply your preferred management.
What’s original here:
- The slope visualization is derived from actual closing-price movement, not Supertrend or ATR overlays.
- The wick/body context markers focus on bars that often precede transitions, presented as optional visuals.
- The reference close overlay is included purely to aid interpretation when comparing views to the native close and for more clear zone and level marking.
Access & intent:
- Educational visualization of structure and slope, providing a framework traders can build upon.
- The author does not provide financial advice. Use at your own discretion.
Disclaimer
This script is provided for educational and informational purposes only. It does not constitute financial advice, investment recommendations, or a solicitation to trade. Past performance is not indicative of future results. The author assumes no responsibility for losses incurred from the use of this tool. TradingView, Inc. has no liability related to this script or its use.
仅限邀请脚本
只有作者授权的用户才能访问此脚本。您需要申请并获得使用许可。通常情况下,付款后即可获得许可。更多详情,请按照下方作者的说明操作,或直接联系One_To_Two_Trades。
TradingView不建议您付费购买或使用任何脚本,除非您完全信任其作者并了解其工作原理。您也可以在我们的社区脚本找到免费的开源替代方案。
作者的说明
For more information please contact Support@122Trades.com
122Trades
免责声明
这些信息和出版物并非旨在提供,也不构成TradingView提供或认可的任何形式的财务、投资、交易或其他类型的建议或推荐。请阅读使用条款了解更多信息。