PROTECTED SOURCE SCRIPT
Canslim
Hey folks, I hope you are doing well!
I made a simple script to determine if a company met the CANSLIM criteria. Some of the criteria are not quantifiable so I left those in olive (you have to do research on those). The rest are quantifiable, which include earnings growth, whether it's a laggard, etc.
CANSLIM is a system developed by William O'Neil for selecting growth stocks by using a combination of fundamental and technical analysis techniques. The stocks that meets the criteria are usually outperformers and return really high gains.
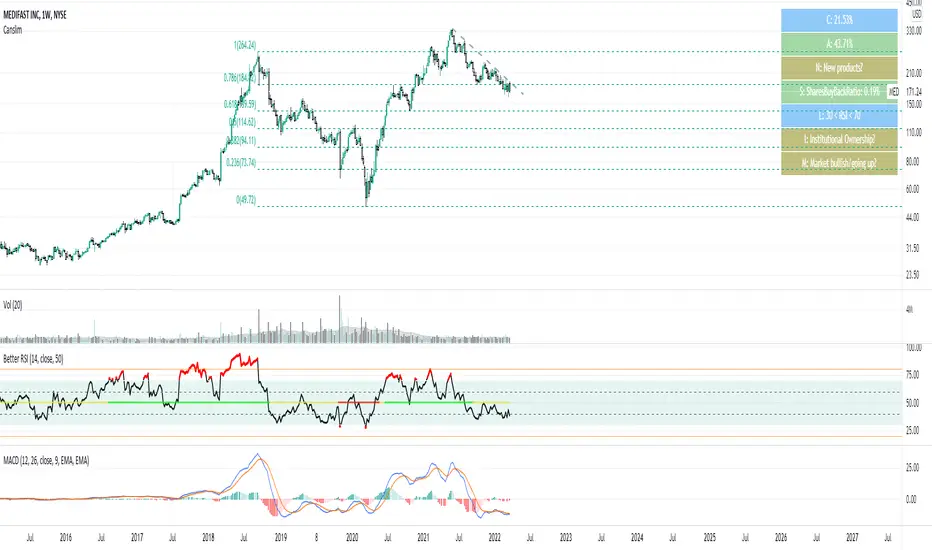
C: Current eps have increased sharply from the same quarter in the prior year. Generally, investors using CANSLIM want EPS growth of over 20%, but the higher the better.
A: Annual earnings increases over the last three (some people use 5 but I prefer 3) years. Annual EPS growth should ideally be in excess of 20% over the last three years.
N: New products, management, or positive new events that push the company's stock to new highs. This type of headline news can cause short-term excitement, propelling a surge of optimism within the market and subsequent. This is also known as a catalyst.
S: Scarce supply coupled with a strong appetite for a stock creates excess demand and an environment in which share prices can soar. Generally, company buying back their own shares, reducing market supply and can indicate an expectation of increased demand along with insider confidence in the firm.
L: Laggard stocks are preferred within the same industry. We can use the RSI to determine whether the company is a laggard or not. An RSI reading below 30 suggests that the stock is oversold and could be undervalued—creating a buying opportunity (bullish). An RSI reading of above 70 signifies that a stock could be overbought or overvalued and could be a chance to sell (bearish). Some people prefer to use "Leader" for the L instead of "Laggard" and I personally think it's a good idea to use both. "Leader" suggests that a stock is a leader in its industry or sector
I: Institutions own the stock (mainly recent above-average performing institutions). For example, this could be a recently public company, still supported by a small handful of well-known private equity firms. Be cautious of stocks that are over-owned by institutions as you want to get in before the big money is fully invested.
M: Market average measures the overall price level of a given market, as defined by a specified group of stocks, such as the Dow Jones Industrial Average. CANSLIM stocks tend to be over-performers in bull markets. Determine the market direction for this one.
The colors:
Green = good
Blue = Neutral/Mediocre
Red = bad
Olive = none/requires own research
I made a simple script to determine if a company met the CANSLIM criteria. Some of the criteria are not quantifiable so I left those in olive (you have to do research on those). The rest are quantifiable, which include earnings growth, whether it's a laggard, etc.
CANSLIM is a system developed by William O'Neil for selecting growth stocks by using a combination of fundamental and technical analysis techniques. The stocks that meets the criteria are usually outperformers and return really high gains.
C: Current eps have increased sharply from the same quarter in the prior year. Generally, investors using CANSLIM want EPS growth of over 20%, but the higher the better.
A: Annual earnings increases over the last three (some people use 5 but I prefer 3) years. Annual EPS growth should ideally be in excess of 20% over the last three years.
N: New products, management, or positive new events that push the company's stock to new highs. This type of headline news can cause short-term excitement, propelling a surge of optimism within the market and subsequent. This is also known as a catalyst.
S: Scarce supply coupled with a strong appetite for a stock creates excess demand and an environment in which share prices can soar. Generally, company buying back their own shares, reducing market supply and can indicate an expectation of increased demand along with insider confidence in the firm.
L: Laggard stocks are preferred within the same industry. We can use the RSI to determine whether the company is a laggard or not. An RSI reading below 30 suggests that the stock is oversold and could be undervalued—creating a buying opportunity (bullish). An RSI reading of above 70 signifies that a stock could be overbought or overvalued and could be a chance to sell (bearish). Some people prefer to use "Leader" for the L instead of "Laggard" and I personally think it's a good idea to use both. "Leader" suggests that a stock is a leader in its industry or sector
I: Institutions own the stock (mainly recent above-average performing institutions). For example, this could be a recently public company, still supported by a small handful of well-known private equity firms. Be cautious of stocks that are over-owned by institutions as you want to get in before the big money is fully invested.
M: Market average measures the overall price level of a given market, as defined by a specified group of stocks, such as the Dow Jones Industrial Average. CANSLIM stocks tend to be over-performers in bull markets. Determine the market direction for this one.
The colors:
Green = good
Blue = Neutral/Mediocre
Red = bad
Olive = none/requires own research
受保护脚本
此脚本以闭源形式发布。 但是,您可以自由使用,没有任何限制 — 了解更多信息这里。
免责声明
这些信息和出版物并非旨在提供,也不构成TradingView提供或认可的任何形式的财务、投资、交易或其他类型的建议或推荐。请阅读使用条款了解更多信息。
受保护脚本
此脚本以闭源形式发布。 但是,您可以自由使用,没有任何限制 — 了解更多信息这里。
免责声明
这些信息和出版物并非旨在提供,也不构成TradingView提供或认可的任何形式的财务、投资、交易或其他类型的建议或推荐。请阅读使用条款了解更多信息。