INVITE-ONLY SCRIPT
已更新 Relative Strength Ratio Chart + Relative Volume Gradient Candles
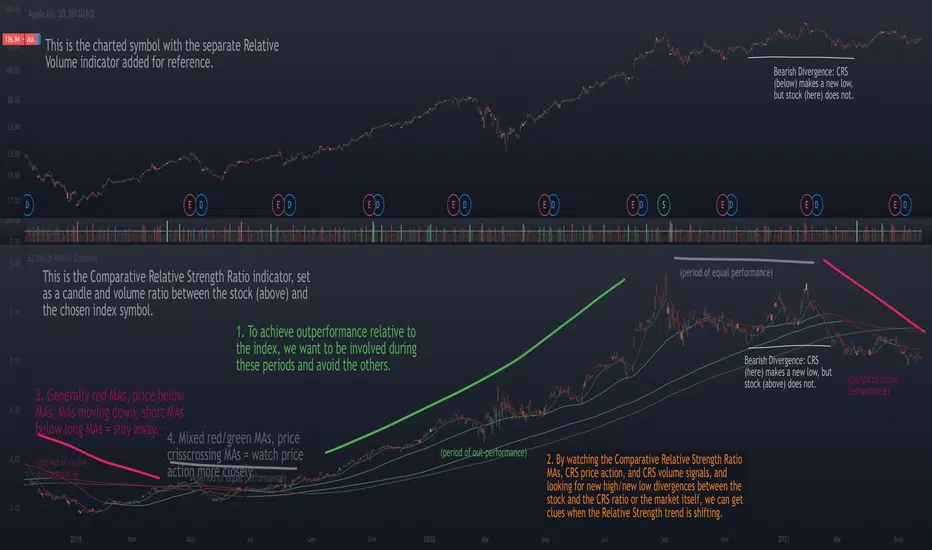
The purpose of the Comparative Relative Strength Ratio indicator is to provide a way of looking at a relative strength ratio as a candle graph instead of only a closing price line, as well as to provide relative volume gradient coloration on the ratio-generated candles, and additionally to plot moving averages of the CRS ratio that can help display shifting trends in relative strength.
This is different from my Relative Volume Gradient Paintbars indicator, as well as my Comparison Chart with Relative Volume Gradient Paintbars indicator, in that the first looks at the charted symbol itself, the second looks at an alternate symbol, and this third indicator looks at a ratio between the charted symbol and the alternate symbol.
The idea behind this indicator is to provide additional means of evaluating relative strength, such as comparing the moving averages of the comparative relative strength ratio graph to the charted stock symbol's own MAs in order to gauge strength, comparing the price action of the ratio to that of the individual stock and its index, and comparing the volume gradient signal between the ratio, the stock, and the index.
The unique volume features allow comparing volume as a percent of the index volume, as well as stock's candle range as a percent of the range of the index. So when the volume as a percentage of the index's overall volume becomes high, this can be made to highlight the candles.
版本注释
Updated to Pine v6 and updated Relative Volume coloration engine to the latest one used in the main standalone Relative Volume indicator (including new z-score mode).仅限邀请脚本
只有作者授权的用户才能访问此脚本。您需要申请并获得使用许可。通常情况下,付款后即可获得许可。更多详情,请按照下方作者的说明操作,或直接联系easycators。
TradingView不建议您付费购买或使用任何脚本,除非您完全信任其作者并了解其工作原理。您也可以在我们的社区脚本找到免费的开源替代方案。
作者的说明
To buy this script, simply use this Paypal link https://paypal.me/josiahredding/100 to send $100, and add your TradingView username in the comment field. I will then add your username to the access list within 1 day and you'll have access indefinitely.
免责声明
这些信息和出版物并非旨在提供,也不构成TradingView提供或认可的任何形式的财务、投资、交易或其他类型的建议或推荐。请阅读使用条款了解更多信息。
仅限邀请脚本
只有作者授权的用户才能访问此脚本。您需要申请并获得使用许可。通常情况下,付款后即可获得许可。更多详情,请按照下方作者的说明操作,或直接联系easycators。
TradingView不建议您付费购买或使用任何脚本,除非您完全信任其作者并了解其工作原理。您也可以在我们的社区脚本找到免费的开源替代方案。
作者的说明
To buy this script, simply use this Paypal link https://paypal.me/josiahredding/100 to send $100, and add your TradingView username in the comment field. I will then add your username to the access list within 1 day and you'll have access indefinitely.
免责声明
这些信息和出版物并非旨在提供,也不构成TradingView提供或认可的任何形式的财务、投资、交易或其他类型的建议或推荐。请阅读使用条款了解更多信息。