OPEN-SOURCE SCRIPT
TSI Indicator with Trailing Stop
Author: ProfitGang
Type: Indicator (visual + alerts). No orders are executed.
What it does
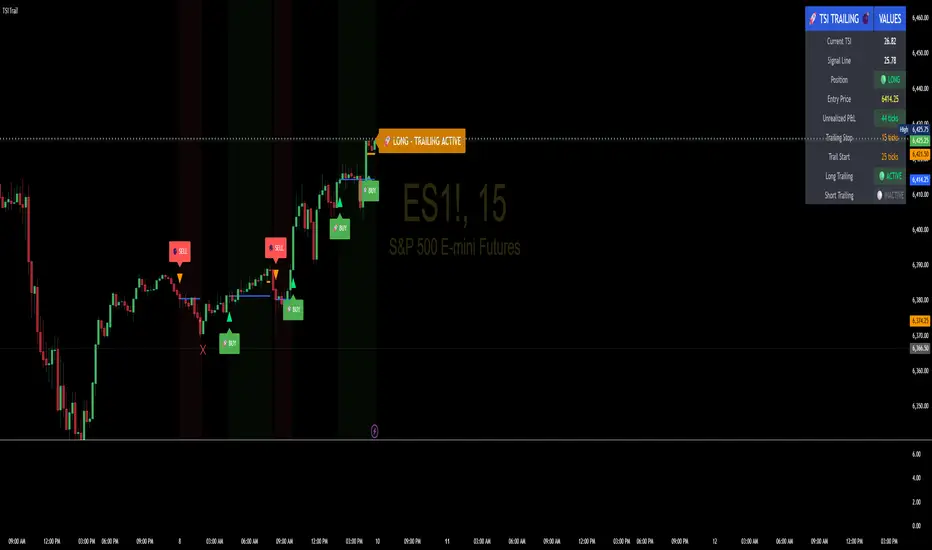
This tool combines the True Strength Index (TSI) with a simple tick-based trailing stop visualizer.
It plots buy/sell markers from a TSI cross with momentum confirmation and, if enabled, draws a trailing stop line that “ratchets” in your favor. It also shows a compact info table (position state, entry price, trailing status, and unrealized ticks).
Signal logic (summary)
TSI is computed with double EMA smoothing (user lengths).
Signals:
Buy when TSI crosses above its signal line and momentum (TSI–Signal histogram) improves, with TSI above your Buy Threshold.
Sell when TSI crosses below its signal line and momentum weakens, with TSI below your Sell Threshold.
Confirmation: Optional “Confirm on bar close” setting evaluates signals on closed bars to reduce repaint risk.
Trailing stop (visual only)
Units are ticks (uses the symbol’s min tick).
Start Trailing After (ticks): activates the trail only once price has moved in your favor by the set amount.
Trailing Stop (ticks): distance from price once active.
For longs: stop = close - trail; it never moves down.
For shorts: stop = close + trail; it never moves up.
Exits shown on chart when the trailing line is touched or an opposite signal occurs.
Note: This is a simulation for visualization and does not place, manage, or guarantee broker orders.
Inputs you can tune
TSI Settings: Long Length, Short Length, Signal Length, Buy/Sell thresholds, Confirm on Close.
Trailing Stop: Start Trailing After (ticks), Trailing Stop (ticks), Show/Hide trailing lines.
Display: Toggle chart signals, info table, and (optionally) TSI plots on the price chart.
Alerts included
TSI Buy / TSI Sell
Long/Short Trailing Activated
Long/Short Trail Exit
Tips for use
Timeframes/markets: Works on any symbol/timeframe that reports a valid min tick. If your market has large ticks, adjust the tick inputs accordingly.
TSI view: By default, TSI lines are hidden to avoid rescaling the price chart. Enable “Show TSI plots on price chart” if you want to see the oscillator inline.
Non-repainting note: With Confirm on bar close enabled, signals are evaluated on closed bars. Intrabar previews can change until the bar closes—this is expected behavior in TradingView.
Limitations
This is an indicator for education/research. It does not execute trades, and visuals may differ from actual broker fills.
Performance varies by market conditions; thresholds and trail settings should be tested by the user.
Disclaimer
Nothing here is financial advice. Markets involve risk, including possible loss of capital. Always do your own research and test on a demo before using any tool in live trading.
— ProfitGang
Type: Indicator (visual + alerts). No orders are executed.
What it does
This tool combines the True Strength Index (TSI) with a simple tick-based trailing stop visualizer.
It plots buy/sell markers from a TSI cross with momentum confirmation and, if enabled, draws a trailing stop line that “ratchets” in your favor. It also shows a compact info table (position state, entry price, trailing status, and unrealized ticks).
Signal logic (summary)
TSI is computed with double EMA smoothing (user lengths).
Signals:
Buy when TSI crosses above its signal line and momentum (TSI–Signal histogram) improves, with TSI above your Buy Threshold.
Sell when TSI crosses below its signal line and momentum weakens, with TSI below your Sell Threshold.
Confirmation: Optional “Confirm on bar close” setting evaluates signals on closed bars to reduce repaint risk.
Trailing stop (visual only)
Units are ticks (uses the symbol’s min tick).
Start Trailing After (ticks): activates the trail only once price has moved in your favor by the set amount.
Trailing Stop (ticks): distance from price once active.
For longs: stop = close - trail; it never moves down.
For shorts: stop = close + trail; it never moves up.
Exits shown on chart when the trailing line is touched or an opposite signal occurs.
Note: This is a simulation for visualization and does not place, manage, or guarantee broker orders.
Inputs you can tune
TSI Settings: Long Length, Short Length, Signal Length, Buy/Sell thresholds, Confirm on Close.
Trailing Stop: Start Trailing After (ticks), Trailing Stop (ticks), Show/Hide trailing lines.
Display: Toggle chart signals, info table, and (optionally) TSI plots on the price chart.
Alerts included
TSI Buy / TSI Sell
Long/Short Trailing Activated
Long/Short Trail Exit
Tips for use
Timeframes/markets: Works on any symbol/timeframe that reports a valid min tick. If your market has large ticks, adjust the tick inputs accordingly.
TSI view: By default, TSI lines are hidden to avoid rescaling the price chart. Enable “Show TSI plots on price chart” if you want to see the oscillator inline.
Non-repainting note: With Confirm on bar close enabled, signals are evaluated on closed bars. Intrabar previews can change until the bar closes—this is expected behavior in TradingView.
Limitations
This is an indicator for education/research. It does not execute trades, and visuals may differ from actual broker fills.
Performance varies by market conditions; thresholds and trail settings should be tested by the user.
Disclaimer
Nothing here is financial advice. Markets involve risk, including possible loss of capital. Always do your own research and test on a demo before using any tool in live trading.
— ProfitGang
开源脚本
秉承TradingView的精神,该脚本的作者将其开源,以便交易者可以查看和验证其功能。向作者致敬!您可以免费使用该脚本,但请记住,重新发布代码须遵守我们的网站规则。
profitgang
haze
haze
免责声明
这些信息和出版物并非旨在提供,也不构成TradingView提供或认可的任何形式的财务、投资、交易或其他类型的建议或推荐。请阅读使用条款了解更多信息。
开源脚本
秉承TradingView的精神,该脚本的作者将其开源,以便交易者可以查看和验证其功能。向作者致敬!您可以免费使用该脚本,但请记住,重新发布代码须遵守我们的网站规则。
profitgang
haze
haze
免责声明
这些信息和出版物并非旨在提供,也不构成TradingView提供或认可的任何形式的财务、投资、交易或其他类型的建议或推荐。请阅读使用条款了解更多信息。