PROTECTED SOURCE SCRIPT
已更新 Fibonacci MTF Retracement & Extension levels
Overview:
This indicator plots Fibonacci retracement and extension levels based on either yesterday's or today's high-low range on a customizable timeframe (default: daily). It is useful for identifying potential support/resistance zones and projecting price targets using Fibonacci ratios.
Features:
Custom Reference Timeframe
Choose any timeframe (e.g., Daily, Weekly, 4H) as the source for high and low calculations.
Flexible Level Source
Choose to plot either:
Yesterday’s Fibonacci levels (default), or Today's real-time Fibonacci levels
Extensive Fibonacci Levels
Supports both common and extended levels, including:
-6.0, -5.618, ..., 0.0, 0.382, 0.618, 1.0, 1.618, ..., 6.0
Customizable Style
Line width and style (solid, dotted, dashed)
Color-coded for negative, main (0 to 1), and above-1 levels
Adjustable label size, text color, and label position (offset)
Efficient and Clean Visualization
Automatically clears previous drawings on each new candle of selected timeframe
Optimized to prevent clutter and overlap
How It Works:
Yesterday Mode: Plots fib levels based on the high/low of the previous candle on your selected timeframe.
Today Mode: Plots fib levels using the current high/low of the ongoing candle.
All lines and labels automatically refresh at the open of each new candle (on your selected timeframe).
版本注释
123版本注释
This indicator plots Fibonacci retracement and extension levels from the high and low of a selected reference timeframe (default: Daily).You can toggle between:
Yesterday’s levels — to track how the market reacts to the prior range
Today’s levels — to monitor evolving levels intraday
Features:
Select any timeframe for reference (e.g., 1H, 4H, 1D, 1W)
Choose between Yesterday’s or Today’s levels
Customize:
Line style (solid/dotted/dashed)
Line width Label size, color, and horizontal offset Color themes for negative, standard, and extended levels
Fibonacci Levels Included:
Standard retracements: 0.236, 0.382, 0.5, 0.618, 0.786, 1.0
Negative retracements: -0.272, -0.618, -1.0, etc.
Extensions: 1.272, 1.618, 2.0, 2.618, and beyond
Dynamic Behavior:
Levels are recalculated automatically each new candle on the reference timeframe.
Labels move horizontally with the chart as new bars form, keeping levels readable.
Best For:
Intraday traders looking for confluence zones
Swing traders using multi-timeframe setups
Traders using Fibonacci for entries/exits or structure analysis
版本注释
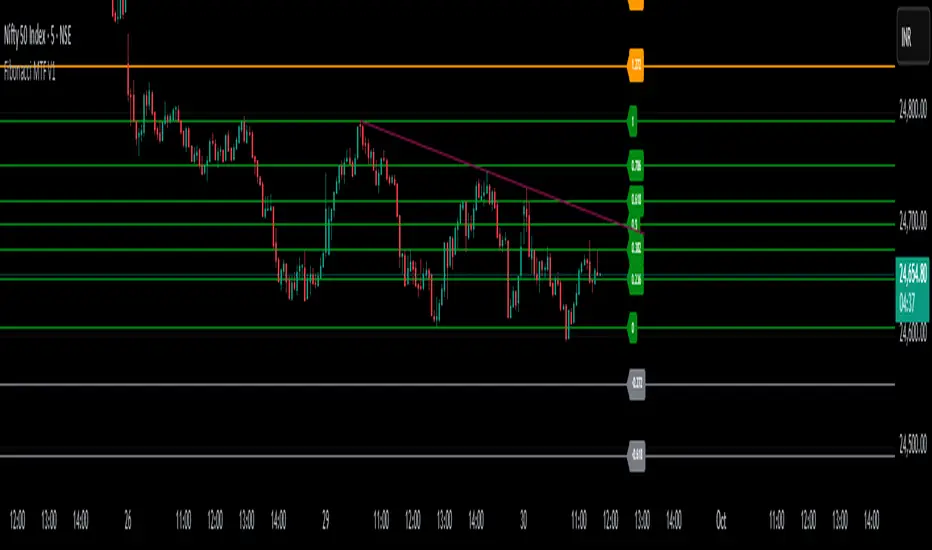
Fibonacci MTF V1 is a dynamic and fully customizable indicator that draws Fibonacci retracement and extension levels based on the high and low of a selected higher timeframe (HTF) — typically daily or any timeframe you choose.Whether you're a day trader, swing trader, or scalper, this tool helps you quickly identify key support and resistance levels derived from higher timeframes, giving you a strategic edge.
Multi-Timeframe Input — Select your reference timeframe (e.g., Daily, 4H, etc.) to anchor your Fibonacci levels.
✅ Choose Between:
Yesterday’s Levels (default): Draws levels from the previous HTF candle
Today’s Levels: Optionally project levels from the current HTF candle
✅ Full Customization:
Line style: Solid, Dotted, Dashed
Line width
Label color, size, and offset
Separate colors for:
Negative extensions (e.g., -0.618, -1.618)
Standard retracements (0.0 to 1.0)
Extensions above 1.0 (e.g., 1.618, 2.618, etc.)
✅ Automatic Line/Label Management:
Efficiently redraws and updates levels on each new candle of the selected timeframe.
Removes old lines to ensure clean charts and better performance.
受保护脚本
此脚本以闭源形式发布。 但是,您可以自由使用它,没有任何限制 — 在此处了解更多信息。
免责声明
这些信息和出版物并不意味着也不构成TradingView提供或认可的金融、投资、交易或其它类型的建议或背书。请在使用条款阅读更多信息。
免责声明
这些信息和出版物并不意味着也不构成TradingView提供或认可的金融、投资、交易或其它类型的建议或背书。请在使用条款阅读更多信息。