OPEN-SOURCE SCRIPT
已更新 350DMA Golden ratio Higher timeframe ma's
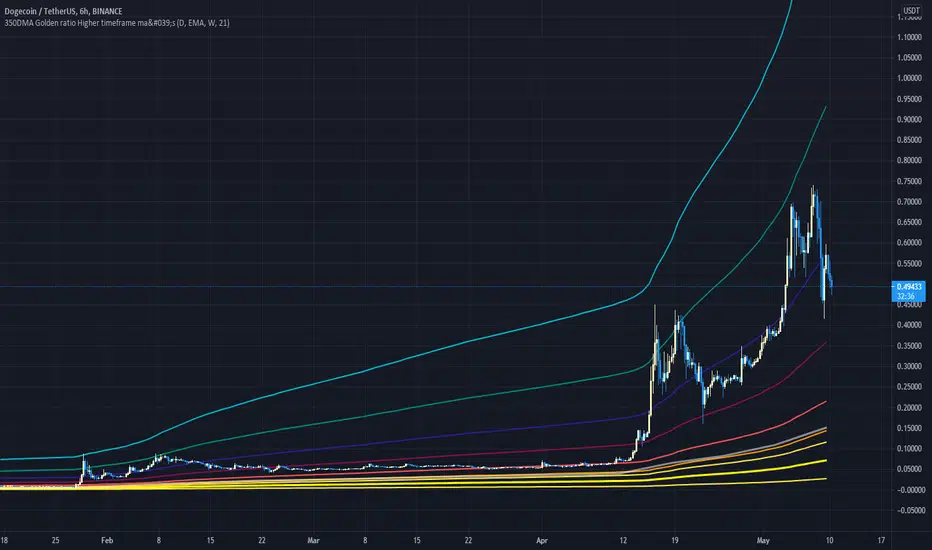
This Script take a 350 day moving average (bright yellow line) and multiplies it by the golden ratio 1.6... and by the Fibonacci sequence (0, 1, 2, 3, 5)
It is a great tool for finding tops and critical supports on higher timeframes.
The script also includes and higher timeframe ma (gray line) that can be set to your liking (default is 21 week).
It is a great tool for finding tops and critical supports on higher timeframes.
The script also includes and higher timeframe ma (gray line) that can be set to your liking (default is 21 week).
版本注释
Added extra fib Levels for assets that are going parabolic. It can be turned on with a button in the settings 版本注释
Removed comment 版本注释
House keeping版本注释
house keeping版本注释
Update Chart版本注释
Fixed miss labeled line item开源脚本
秉承TradingView的精神,该脚本的作者将其开源,以便交易者可以查看和验证其功能。向作者致敬!您可以免费使用该脚本,但请记住,重新发布代码须遵守我们的网站规则。
免责声明
这些信息和出版物并非旨在提供,也不构成TradingView提供或认可的任何形式的财务、投资、交易或其他类型的建议或推荐。请阅读使用条款了解更多信息。
开源脚本
秉承TradingView的精神,该脚本的作者将其开源,以便交易者可以查看和验证其功能。向作者致敬!您可以免费使用该脚本,但请记住,重新发布代码须遵守我们的网站规则。
免责声明
这些信息和出版物并非旨在提供,也不构成TradingView提供或认可的任何形式的财务、投资、交易或其他类型的建议或推荐。请阅读使用条款了解更多信息。