OPEN-SOURCE SCRIPT
Quadratic MA
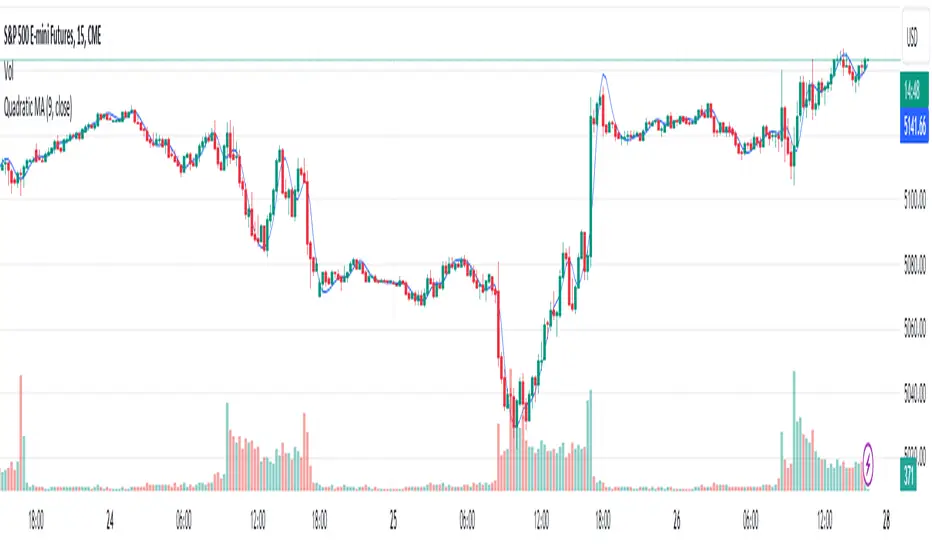
The Quadratic Moving Average (QMA) is an advanced smoothing indicator that provides a smoother and more responsive moving average by applying the Weighted Moving Average (WMA) methodology in a unique, multi-layered approach. This indicator is especially useful for identifying trends in highly volatile markets where data points vary significantly.
Calculation:
The QMA is calculated by first determining a basic WMA over half the specified period and then modifying it by subtracting the WMA over the full period, effectively emphasizing recent price changes. This result is then re-smoothed using another WMA function applied over the square root of the specified length, providing a quadratic enhancement to the typical WMA.
Usage:
The QMA can be particularly effective in trend-following strategies. When the price moves above the QMA line, it may indicate a bullish trend, suggesting a potential buy signal. Conversely, if the price falls below the QMA line, it may signal a bearish trend, indicating a potential sell signal.
Settings:
Length: Controls the sensitivity of the QMA to price changes. A shorter length will make the QMA more responsive to price changes, while a longer length will smooth out the moving average further, potentially reducing the number of signals and noise.
Tips:
Combine the QMA with other forms of analysis, such as volume indicators or momentum oscillators, to confirm trends and refine trading signals.
Adjust the length parameter according to your trading style and the asset's volatility to optimize performance.
开源脚本
秉承TradingView的精神,该脚本的作者将其开源,以便交易者可以查看和验证其功能。向作者致敬!您可以免费使用该脚本,但请记住,重新发布代码须遵守我们的网站规则。
免责声明
这些信息和出版物并非旨在提供,也不构成TradingView提供或认可的任何形式的财务、投资、交易或其他类型的建议或推荐。请阅读使用条款了解更多信息。
开源脚本
秉承TradingView的精神,该脚本的作者将其开源,以便交易者可以查看和验证其功能。向作者致敬!您可以免费使用该脚本,但请记住,重新发布代码须遵守我们的网站规则。
免责声明
这些信息和出版物并非旨在提供,也不构成TradingView提供或认可的任何形式的财务、投资、交易或其他类型的建议或推荐。请阅读使用条款了解更多信息。