OPEN-SOURCE SCRIPT
Diodato 'All Stars Align' Signal
Description:
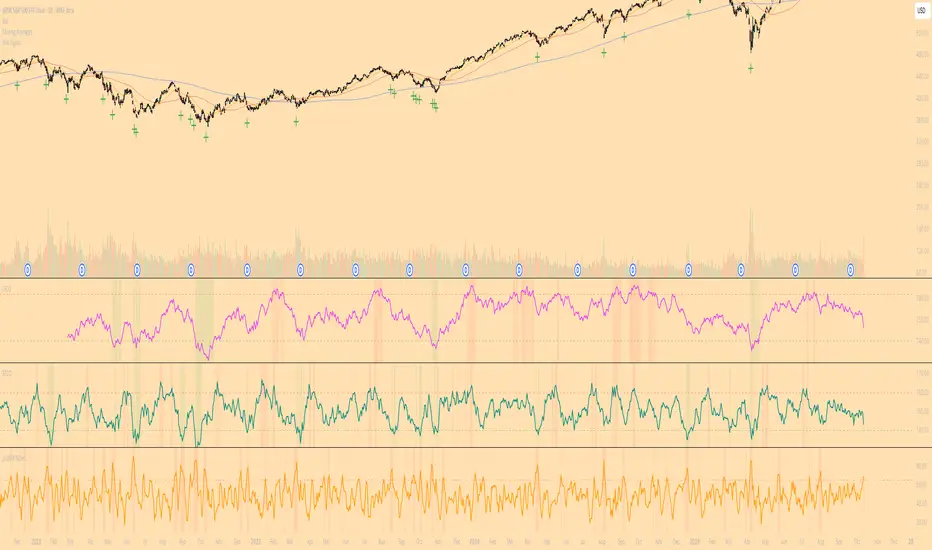
This indicator is an overlay that plots the "All Stars Align" buy signal from Chris Diodato's 2019 CMT paper, "Making The Most Of Panic." It is designed to identify high-conviction, short-term buying opportunities by requiring a confluence of both price-based momentum and market-internal weakness.
What It Is
This script works entirely in the background, calculating three separate indicators: the 14-day Slow Stochastic, the Short-Term Capitulation Oscillator (STCO), and the 3-DMA of % Declining Issues. It then plots a signal directly on the main price chart only when the specific "All Stars Align" conditions are met.
How to Interpret
A green cross (+) appears below a price bar when a high-conviction buy signal is generated. This signal triggers only when two primary conditions are true:
The 14-day Slow Stochastic is in "oversold" territory (e.g., below 20).
AND at least one of the market internal indicators shows a state of panic:
Either the STCO is oversold (e.g., below 140).
Or the 3-DMA % Declines shows a panic spike (e.g., above 65).
This confluence signifies a potential exhaustion of sellers and can mark an opportune moment to look for entries.
Settings
Trigger Thresholds: You can customize the exact levels that define an "oversold" or "panic" state for each of the three underlying indicators.
Data Sources: Allows toggling the use of "Unchanged" data for the background calculations.
Stochastic Settings: You can adjust the parameters for the Slow Stochastic calculation.
开源脚本
秉承TradingView的精神,该脚本的作者将其开源,以便交易者可以查看和验证其功能。向作者致敬!您可以免费使用该脚本,但请记住,重新发布代码须遵守我们的网站规则。
免责声明
这些信息和出版物并非旨在提供,也不构成TradingView提供或认可的任何形式的财务、投资、交易或其他类型的建议或推荐。请阅读使用条款了解更多信息。
免责声明
这些信息和出版物并非旨在提供,也不构成TradingView提供或认可的任何形式的财务、投资、交易或其他类型的建议或推荐。请阅读使用条款了解更多信息。